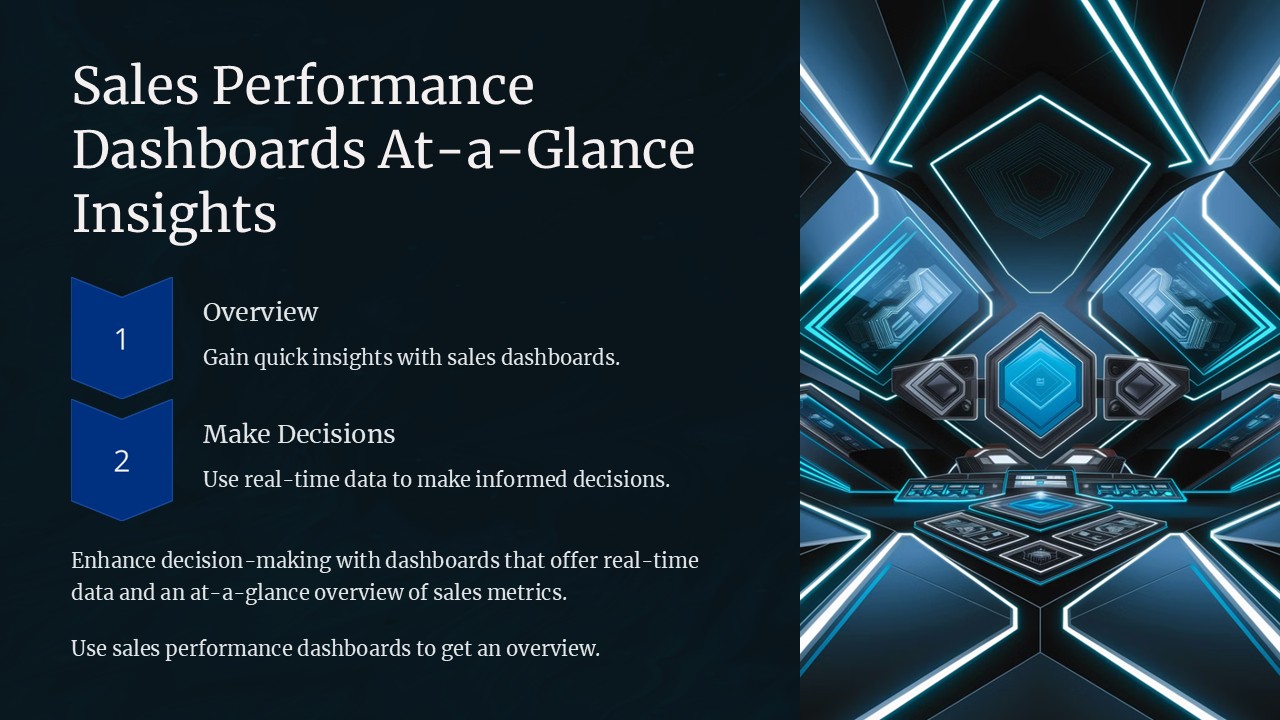
Introducing the “Sales Performance Dashboards At a Glance Insights PowerPoint Presentation” – the ultimate solution designed to empower your sales team with real-time insights and analytics. This comprehensive PowerPoint presentation package is meticulously crafted to provide a clear and concise visualization of your sales data, enabling you to make informed decisions quickly and efficiently.
In today’s fast-paced business environment, having instant access to your sales performance metrics can set you apart from the competition. Our Sales Performance Dashboards presentation offers a visually engaging way to display critical sales data such as sales trends, revenue forecasts, individual and team performances, and much more. With this tool, you can easily identify key performance indicators (KPIs), track progress against sales goals, and pinpoint areas for improvement.
This presentation is not just a collection of charts and graphs. It is a strategic tool tailored to meet the needs of sales managers, business analysts, and executives who rely on data to drive sales strategies and boost performance. Each slide is thoughtfully designed to highlight important data points and trends, making it easy for your audience to understand complex information at a glance.
Whether you are presenting to stakeholders, leading a sales team meeting, or conducting a quarterly review, the Sales Performance Dashboards At a Glance Insights PowerPoint Presentation has everything you need to present your sales data with confidence and clarity. It is perfect for organizations of all sizes and industries looking to enhance their sales reporting and analytics capabilities.
Features:
– Fully Editable Templates: Each element of the PowerPoint presentation can be customized to fit your specific needs. You can easily change colors, adjust text, or modify graphics without any loss in quality. This feature ensures that your presentation aligns perfectly with your company’s branding and presentation standards.
– Supports PowerPoint Templates and Google Slides: Flexibility is key in today’s digital world. Our sales dashboard presentation is compatible with both Microsoft PowerPoint and Google Slides. This compatibility allows you to access and present your sales data using the platform that best suits your needs and preferences.
– Comprehensive Data Visualization Tools: The presentation includes a variety of data visualization tools such as bar charts, line graphs, pie charts, and gauges. These tools are designed to make your data more accessible and engaging, helping your audience quickly grasp the insights being presented.
– Dynamic Layouts and Designs: With dynamic layouts and creative designs, the Sales Performance Dashboards presentation stands out from standard, text-heavy presentations. It is crafted to catch the viewer’s eye and keep them engaged throughout your presentation.
– Easy to Use and Update: You do not need to be a tech expert to use this presentation. It is designed for easy use and updates, allowing you to maintain up-to-date data with minimal effort. This ease of use ensures that your sales data is always current and ready for any impromptu meetings or presentations.
Empower your sales team and impress your stakeholders with the “Sales Performance Dashboards At a Glance Insights PowerPoint Presentation.” It’s more than just a presentation; it’s a powerful tool for driving sales success.


Be the first to review “Sales Performance Dashboards At a Glance Insights PowerPoint Presentation”