Skip to content
    • Log In
    • Register
  • BLOG
  • FAQ
  • ABOUT US
  • CONTACT US
  • PRIVACY POLICY
  • Plans & Pricing
    • Log In
    • Register
SlidevillaSlidevilla

  • Plans & Pricing
  • ALL PRODUCTS
  • Login
  • PowerPoint Templates
    • Agile
    • Business PowerPoint Templates
    • Roadmap
    • Strategy
    • PowerPoint Backgrounds
    • Resume Templates
    • Progressive Roadmap
    • Self Introcution PPT
    • Diversity And Inclusion PPT
    • Roadmap PPT
    • Social Media
    • Kids
    • Idea
    • Health And Fitness
    • Technology
    • Pricing
    • PowerPoint Presentations
    • Slide Deck
  • PowerPoint Diagrams
    • Arrow Diagrams
    • Circular Diagrams
    • Flow Chart Diagrams
    • Funnel Diagrams
    • Process Flow Diagrams
    • Segmented Diagrams
    • Staged Diagrams
  • Power Point Maps
    • Africa
    • Asia
    • South America
    • Central America
    • Europe
    • North America
    • Oceania
    • World Maps & Globes
  • PowerPoint Shapes
    • 3D Shapes for PowerPoint
    • Cartoons
    • Creative
    • Gauges & Meters
    • Recycle
    • Traffic Lights & Signs Gears
  • Data & Charts
    • Bar Chart Presentation
    • Curves and Statistical
    • Pie Charts
    • Dashboards
  • Text & Tables
    • Creative Layouts
    • Comparison PPT Template
    • Comparison Template
  • Login
Home / Shop / PowerPoint Diagrams / Process Flow Diagrams
  • Risk Management KPI Dashboard PowerPoint Template
  • Healthcare Planning and Strategy Presentation Template
Add to Wishlist
Project Problem and Issue Tracking KPI Dashboard PowerPoint Template
Project Problem and Issue Tracking KPI Dashboard PowerPoint Template1
Project Problem and Issue Tracking KPI Dashboard PowerPoint Template2

Project Problem and Issue Tracking KPI Dashboard PowerPoint Template

Rated 4.30 out of 5 based on 10 customer ratings
Download

Categories: Business PowerPoint Templates, PowerPoint Diagrams, PowerPoint Templates, Process Flow Diagrams Tags: project issues, project problem
Browse
  • Data & Charts
    • Bar Chart Presentation
    • Curves and Statistical
    • Dashboards
    • Pie Charts
  • Free for All
  • Power Point Maps
    • Africa
    • Asia
    • Central America
    • Europe
    • North America
    • Oceania
    • South America
    • World Maps & Globes
  • Power Point Text & Tables
    • Comparison PPT Template
    • Creative Layouts
  • PowerPoint Diagrams
    • Arrow Diagrams
    • Circular Diagrams
    • Flow Chart Diagrams
    • Funnel Diagrams
    • Process Flow Diagrams
    • Segmented Diagrams
    • Staged Diagrams
  • PowerPoint Presentations
  • PowerPoint Shapes
    • 3D Shapes for PowerPoint
    • Cartoons
    • Creative
    • Gauges & Meters
    • Recycle
    • Traffic Lights & Signs Gears
  • PowerPoint Templates
    • Agile
    • Business PowerPoint Templates
    • Health And Fitness
    • Idea
    • Kids
    • PowerPoint Backgrounds
    • Pricing
    • Resume Templates
    • Roadmap
    • Social Media
    • Strategy
    • Technology
  • Slide Deck
  • Description
  • Reviews (10)

Introducing our Project Problem and Issue Tracking KPI Dashboard PowerPoint Template – the ultimate presentation ppt for effective project management and issue tracking. This professionally designed template is specifically crafted to help you stay on top of your project’s progress, identify problems, and track key performance indicators (KPIs) seamlessly.

With this template, you’ll have everything you need to create a visually appealing and informative dashboard that showcases the status of your project, identifies bottlenecks, and provides valuable insights to drive decision-making. Let’s delve into the key features and benefits that make this template a must-have for project managers and teams:

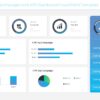
  1. Comprehensive Tracking: Our template offers a comprehensive set of tracking elements to monitor the progress of your project. You can easily visualize key metrics, such as task completion rates, issue resolution times, and overall project status, in a single, easy-to-understand dashboard.
  2. Interactive Charts and Graphs: Present your project data in a visually compelling manner with a wide range of interactive charts and graphs. Whether you need to display progress over time, compare different teams or departments, or analyze trends, our template provides various chart options to suit your needs.
  3. Problem and Issue Identification: Quickly identify and address project problems and issues through dedicated sections within the dashboard. With clear visuals and intuitive design, you can pinpoint areas that require attention, ensuring timely resolution and improved project performance.
  4. Customizable Layout: Tailor the template to match your specific project requirements and branding. Our PowerPoint template allows you to customize colors, fonts, and layouts effortlessly, giving you the flexibility to create a dashboard that aligns with your project’s unique needs.
  5. Easy Data Integration: Seamlessly integrate your project data into the dashboard. Whether you use Excel, Google Sheets, or other data sources, our template allows you to import and update information effortlessly, saving you time and effort in manual data entry.
  6. Streamlined Communication: Enhance collaboration and communication among team members and stakeholders by sharing the dashboard in PowerPoint format. The visually engaging presentation will enable you to effectively convey project progress, highlight critical issues, and foster informed decision-making.
  7. Time-saving Solution: By leveraging our pre-designed template, you can significantly reduce the time and effort required to create a project problem and issue tracking dashboard from scratch. Instead of spending hours on design and formatting, you can focus on analyzing data, resolving issues, and driving project success.

In conclusion, our Project Problem and Issue Tracking KPI Dashboard PowerPoint Template is an indispensable resource for any project manager or team seeking to improve project management, track key metrics, and address issues promptly. With its comprehensive tracking capabilities, customizable layout, and easy data integration, this template empowers you to streamline your project management processes and ensure successful project outcomes. Get started today and take your project management to the next level!

Features:

  • Completely editable in terms of shape, color, size and text
  • This template has a built in color theme which is unaffected by copy-pasting
  • Includes an icon family with 135 unique completely editable icons
  • Drag and drop image placeholder
  • Completely editable (using spreadsheet) data-driven charts for displaying statistics
  • Completely editable vector graphics

Supports
Microsoft PowerPoint 2010, 2011, 2013, 2016
MacOffice 2016, MacOffice 365, Keynote, Google Slides

Use Cases For Project Problem and Issue Tracking KPI Dashboard PowerPoint Template

  • Project Management: Monitor project progress and identify potential roadblocks or issues with real-time tracking. Keep stakeholders informed and make data-driven decisions to ensure project success.
  • Issue Resolution: Track and prioritize project issues efficiently. Assign tasks, set deadlines, and monitor resolution progress to ensure timely resolution and minimize project delays.
  • Risk Management: Identify, assess, and mitigate project risks effectively. Visualize risk severity, probability, and impact to prioritize risk response strategies and proactively manage potential threats to project success.
  • Performance Monitoring: Monitor key performance indicators (KPIs) to gauge project health and performance. Track metrics such as task completion rates, issue resolution times, and overall project progress to identify areas for improvement and optimize project performance.
  • Stakeholder Communication: Facilitate transparent communication with project stakeholders. Use the dashboard to provide stakeholders with real-time updates on project issues, risks, and performance metrics, fostering trust and alignment throughout the project lifecycle.
  • Resource Allocation: Optimize resource allocation and utilization. Identify resource constraints and potential bottlenecks to allocate resources effectively, ensuring that project teams have the necessary resources to address project issues and deliver results on time and within budget.
  • Continuous Improvement: Drive continuous improvement initiatives by analyzing historical project data. Identify recurring issues, root causes, and trends to implement corrective actions and enhance project delivery processes over time.
  • Quality Assurance: Ensure project quality by tracking and addressing issues promptly. Monitor quality metrics and issue resolution times to identify areas for improvement and implement corrective actions to maintain high-quality project deliverables.
  • Client Satisfaction: Enhance client satisfaction by proactively addressing project issues and risks. Use the dashboard to track client-reported issues, prioritize resolution efforts, and communicate progress updates to clients, demonstrating a commitment to delivering value and meeting client expectations.
  • Cross-Functional Collaboration: Foster collaboration among project teams and stakeholders. Centralize project information and facilitate collaboration by providing stakeholders with access to real-time project data, enabling cross-functional teams to work together efficiently to address project challenges and drive project success.

10 reviews for Project Problem and Issue Tracking KPI Dashboard PowerPoint Template

  1. Rated 5 out of 5

    Christine – June 27, 2023

    Very impressive, saved lot of time

  2. Rated 5 out of 5

    Julie – June 29, 2023

    Good

  3. Rated 5 out of 5

    Parker – July 5, 2023

    Nice detailed dashboard. Thanks

  4. Rated 4 out of 5

    James – July 14, 2023

    Fantastic!!

  5. Rated 4 out of 5

    Clark – July 16, 2023

    Nice one

  6. Rated 4 out of 5

    Milly – July 20, 2023

    Perfect

  7. Rated 4 out of 5

    Seraphina – August 14, 2023

    Best and easy to use.

  8. Rated 4 out of 5

    Abdullah – September 26, 2023

    saves lot of my time, fun to edit it

  9. Rated 4 out of 5

    Nichola – October 5, 2023

    Easy to use and I have completed my presentation in 10 minutes. Very professional

  10. Rated 4 out of 5

    Sandra – November 10, 2023

    Good presentation

Add a review Cancel reply

Best Selling
  • Editable Brazil Map Template for PowerPoint
  • Business process and achievement template Business process and achievement template
    Rated 4.30 out of 5
  • Timeline for sales promotion Powerpoint template Timeline for sales promotion Powerpoint template
    Rated 4.20 out of 5
  • 5 step vertical banner timeline PowerPoint template 5 step vertical banner timeline PowerPoint template
    Rated 4.50 out of 5
Slides
  • Visualizing Data With Iceberg Graphics PowerPoint Presentation
  • World Map Travel PowerPoint Presentation
  • World Map Arrows PowerPoint Presentation
  • Timeline With Phases PowerPoint Presentation
Featured
  • Go to Market Strategy template Go to Market Strategy template
    Rated 4.40 out of 5
    £5.00
  • Business Startup Powerpoint Template Business Startup Powerpoint Template
    Rated 4.43 out of 5
  • 5 Step Creative Cloud Diagram Template 5 Step Creative Cloud Diagram Template
  • Biochemistry slide template ppt Biochemistry slide template ppt
Top Rated
  • Ladder Infographic template Ladder Infographic template
    Rated 5.00 out of 5
  • Agile User Acceptance Testing Template Agile User Acceptance Testing Template
    Rated 5.00 out of 5
  • Global Business Map PowerPoint Template Global Business Map PowerPoint Template
    Rated 5.00 out of 5
  • Woman Crawl Walk Run Fly PowerPoint Slide Woman Crawl Walk Run Fly PowerPoint Slide
    Rated 5.00 out of 5
Our Clinets
COMPANY
  • BLOG
  • FAQ
  • ABOUT US
  • CONTACT US
  • PRIVACY POLICY
Product categories
  • Data & Charts
    • Bar Chart Presentation
    • Curves and Statistical
    • Dashboards
    • Pie Charts
  • Free for All
  • Power Point Maps
    • Africa
    • Asia
    • Central America
    • Europe
    • North America
    • Oceania
    • South America
    • World Maps & Globes
  • Power Point Text & Tables
    • Comparison PPT Template
    • Creative Layouts
  • PowerPoint Diagrams
    • Arrow Diagrams
    • Circular Diagrams
    • Flow Chart Diagrams
    • Funnel Diagrams
    • Process Flow Diagrams
    • Segmented Diagrams
    • Staged Diagrams
  • PowerPoint Presentations
  • PowerPoint Shapes
    • 3D Shapes for PowerPoint
    • Cartoons
    • Creative
    • Gauges & Meters
    • Recycle
    • Traffic Lights & Signs Gears
  • PowerPoint Templates
    • Agile
    • Business PowerPoint Templates
    • Health And Fitness
    • Idea
    • Kids
    • PowerPoint Backgrounds
    • Pricing
    • Resume Templates
    • Roadmap
    • Social Media
    • Strategy
    • Technology
  • Slide Deck
Recent Posts
  • Best Acknowledgment Samples and examples
  • 23
    Jul
    Você sabe que a roda de cores simples pode chamar a atenção?
  • Do you know the simple color wheel can catch the eye?
Copyright 2025 © SlideVilla.Com
  • Login
  • Sign Up
Forgot Password?
Lost your password? Please enter your username or email address. You will receive a link to create a new password via email.
Connect with:
Google

Login

Lost your password?

Register

Your personal data will be used to support your experience throughout this website, to manage access to your account, and for other purposes described in our privacy policy.