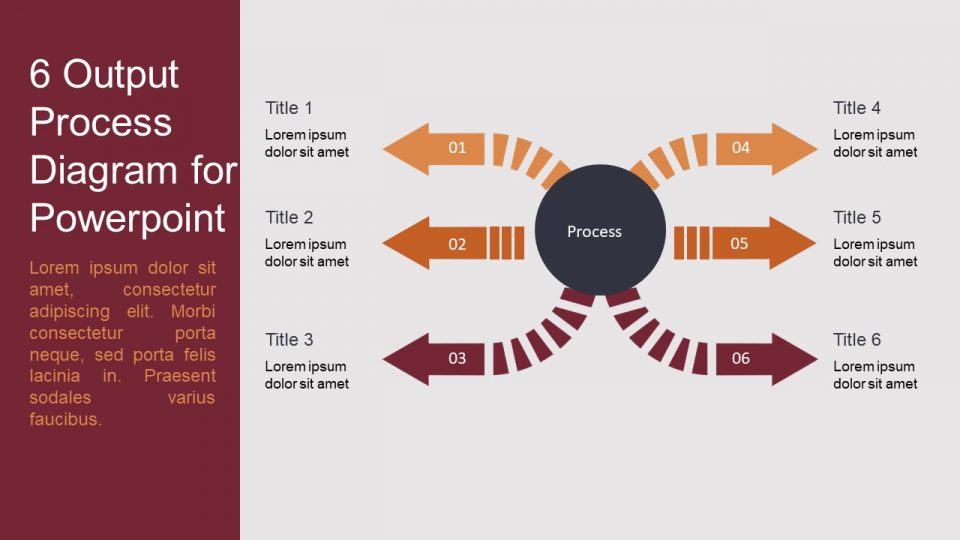
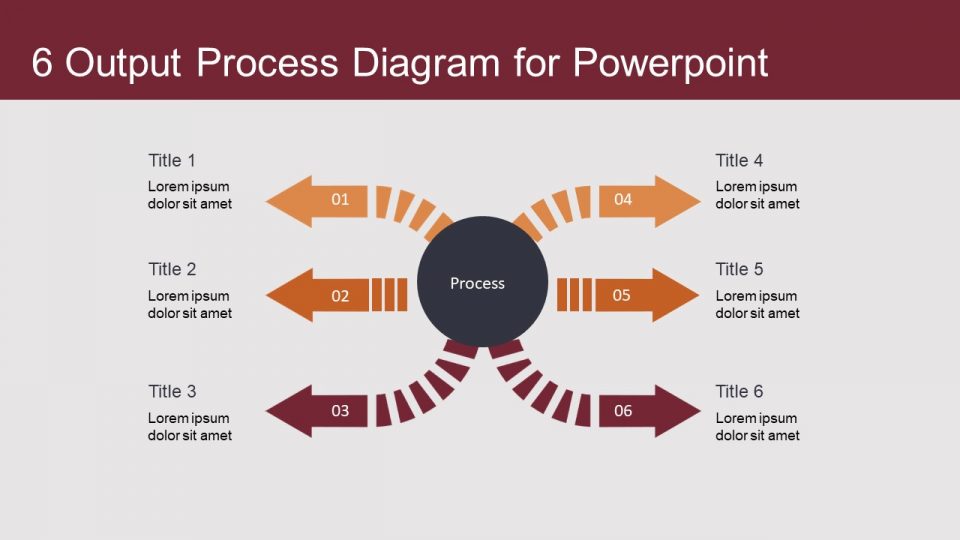
6 Output Process Diagram for PowerPoint presents multiple outcomes horizontal arrow diagram which shows the process. This diagram can be used in the project management in highlighting the process. This is very simplified 6 output diagram which can be used by the professionals to present various direction ways. This 6 output process diagram contains 2 slides which shows 3 direction in left and 3 direction arrows in left. These arrows are fully editable and user can able to edit colors size and even the position of each arrows. In 6 Output Process Diagram for PowerPoint users can take an advantages to use the pre designed powerpoint presentation slide and a variety is available on slidevilla catalog. These slides are also used in google slides in for of themes and powerpoint.
Features:
- Completely editable in terms of shape, color, size and text
- This template has a built in color theme which is unaffected by copy-pasting
- Includes an icon family with 135 unique completely editable icons
- Drag and drop image placeholder
- Completely editable (using spreadsheet) data-driven charts for displaying statistics
- Completely editable vector graphics
Supports
Microsoft PowerPoint 2010, 2011, 2013, 2016
MacOffice 2016, MacOffice 365, Google Slides


Be the first to review “6 Output Process Diagram for Powerpoint”