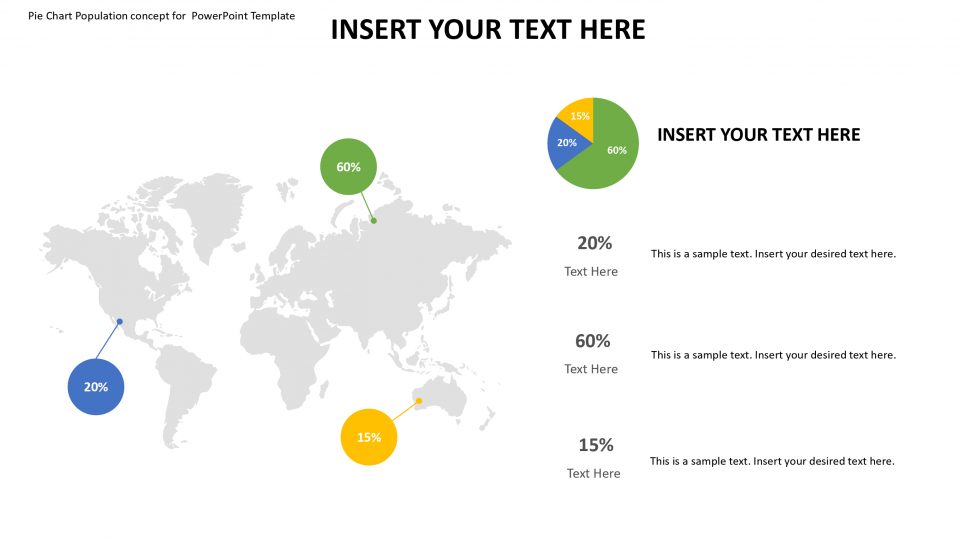
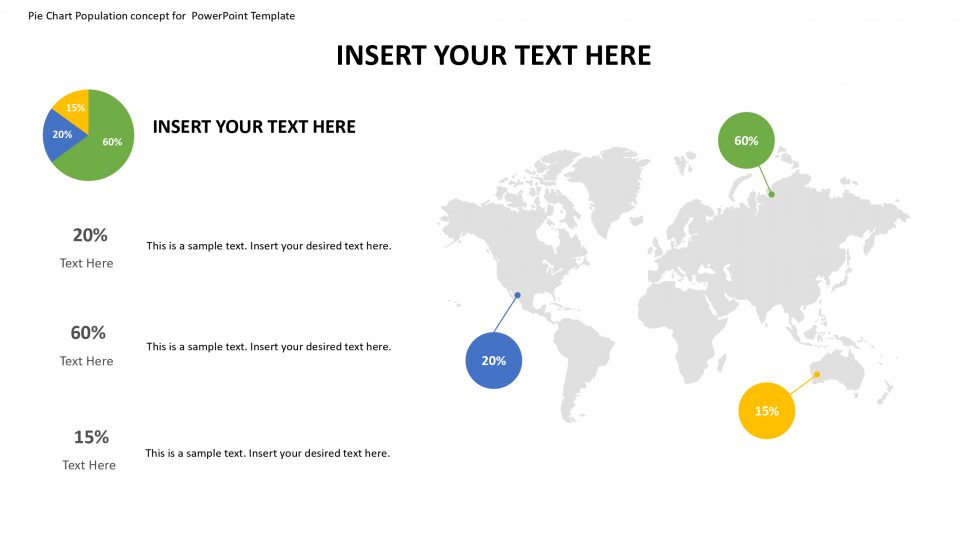
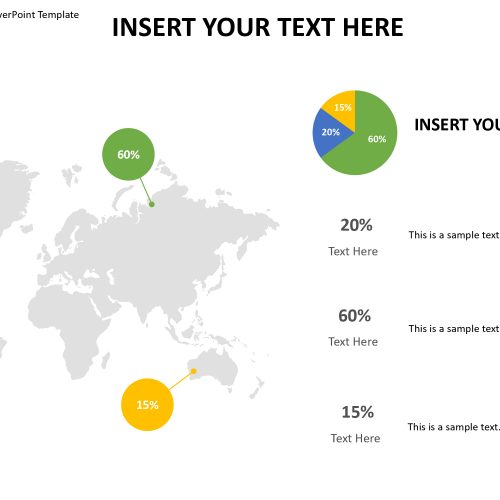
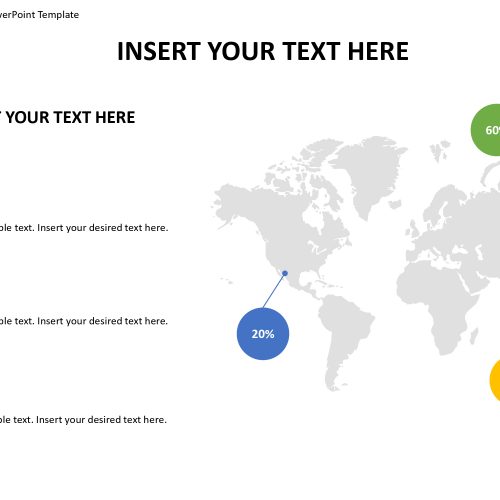
This template is used for imputing population figures, this template is colorful and helps the audience know the population or amount that stands for a particular concepts.
Concepts or topics are represented by editable icons which are color specific.Organized with level shapes and striking articles, the PowerPoint design is a convincing visual guide. The diagram appear with significant images and default compositions. The constrained printed substance makes it interesting and engaging. It can no doubt interest to overall groups.
Features:
- Completely editable in terms of shape, color, size and text
- This template has a built in color theme which is unaffected by copy-pasting
- Includes an icon family with 135 unique completely editable icons
- Drag and drop image placeholder
- Completely editable (using spreadsheet) data-driven charts for displaying statistics
- Completely editable vector graphics
Supports
Microsoft PowerPoint 2010, 2011, 2013, 2016
MacOffice 2016, MacOffice 365


Be the first to review “Pie Chart Population concept for PowerPoint Template”