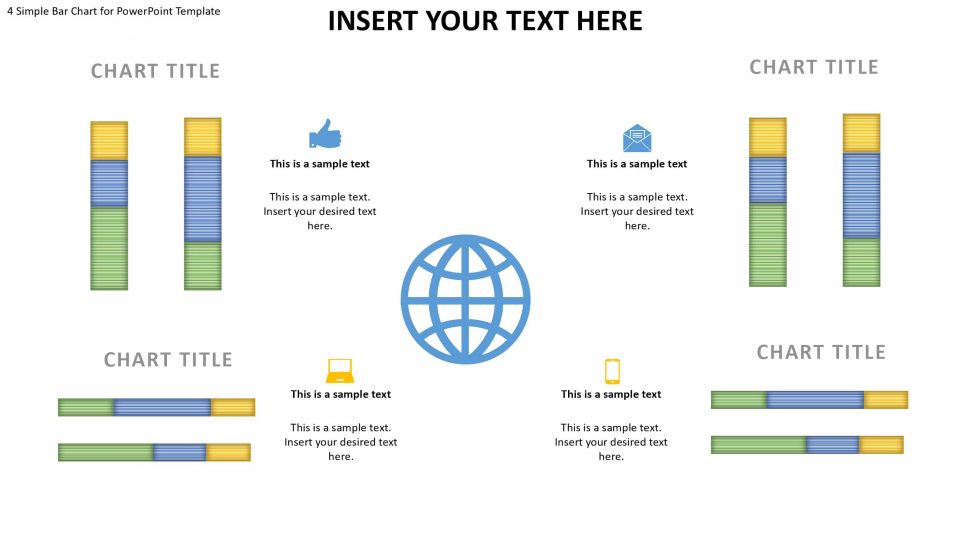
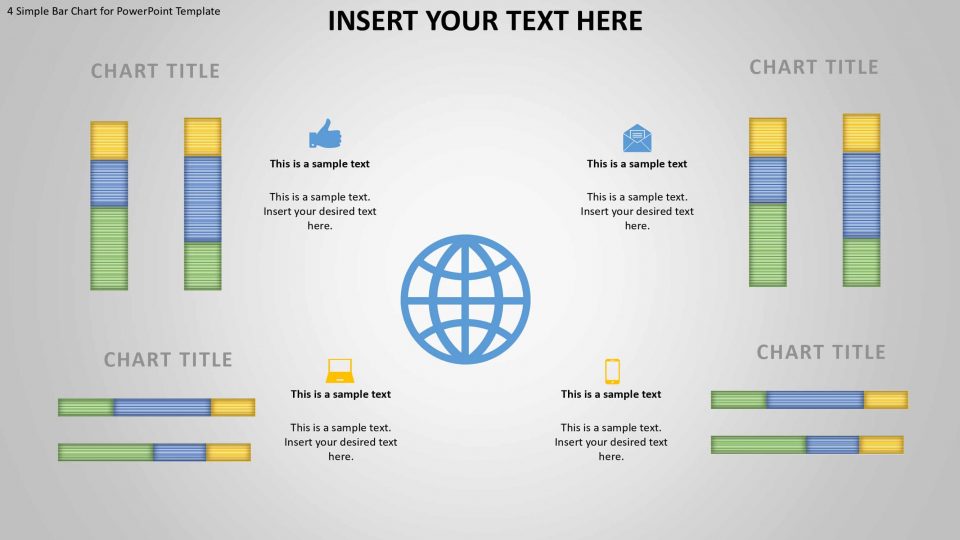
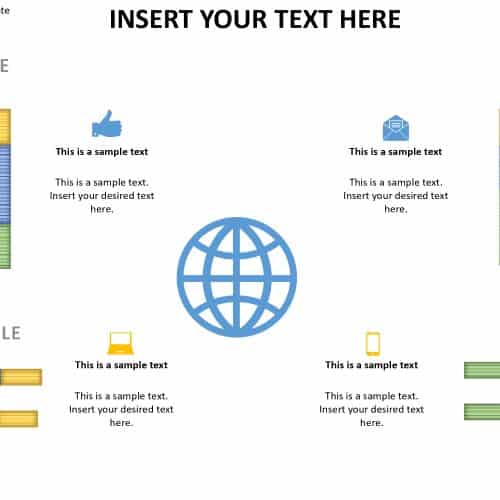
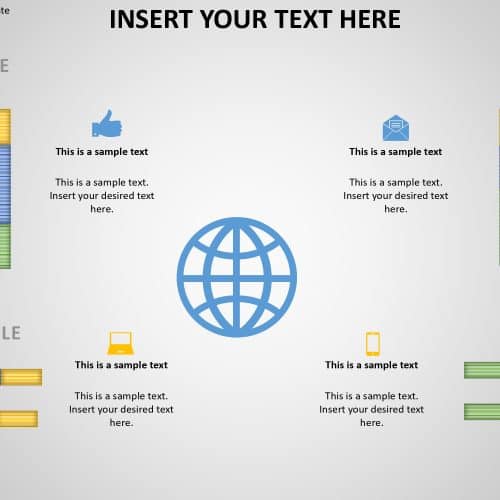
SlideVilla’s 4 Simple Bar Chart PowerPoint Template is best used in presenting information or topics that discusses on research studies or scientific research studies on any field. This is highly recommended to users or researchers who needs to present numerical or statistical data to further understand the study being presented. The PowerPoint Background of this type of template has an image of a globe at the center and on the sides there are different icons and beside the icons, there are line graphs to present the data. There are two slides provided for this template. The first slide has a theme of white while the second slide has a theme of gradient gray to white. Also, this google slide template is easily modifiable, customizable, and user-friendly which means the user is free to edit and customize the style of the presentation.
Features:
- Completely editable in terms of shape, color, size and text
- This template has a built in color theme which is unaffected by copy-pasting
- Includes an icon family with 135 unique completely editable icons
- Drag and drop image placeholder
- Completely editable (using spreadsheet) data-driven charts for displaying statistics
- Completely editable vector graphics
Supports
Microsoft PowerPoint 2010, 2011, 2013, 2016
MacOffice 2016, MacOffice 365


Be the first to review “4 Simple Bar Chart for PowerPoint Template”