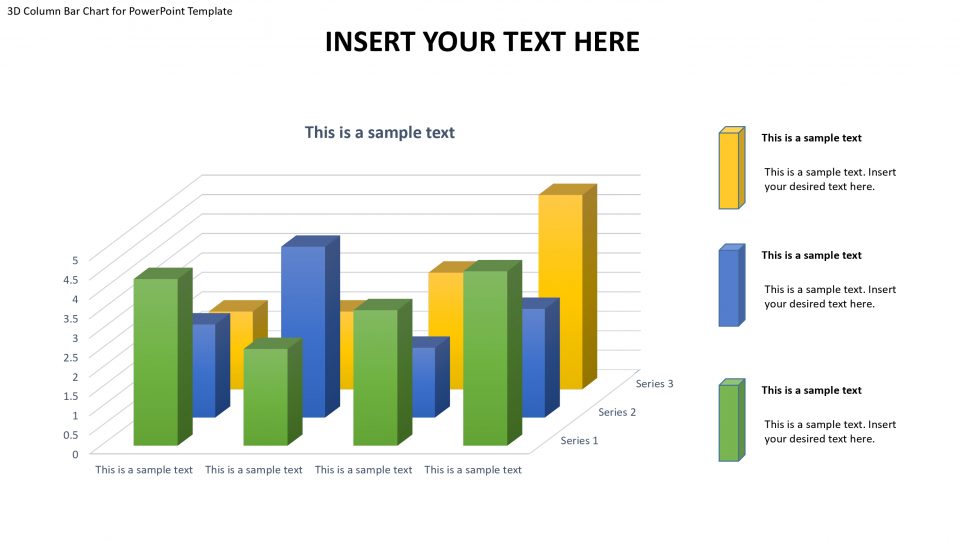
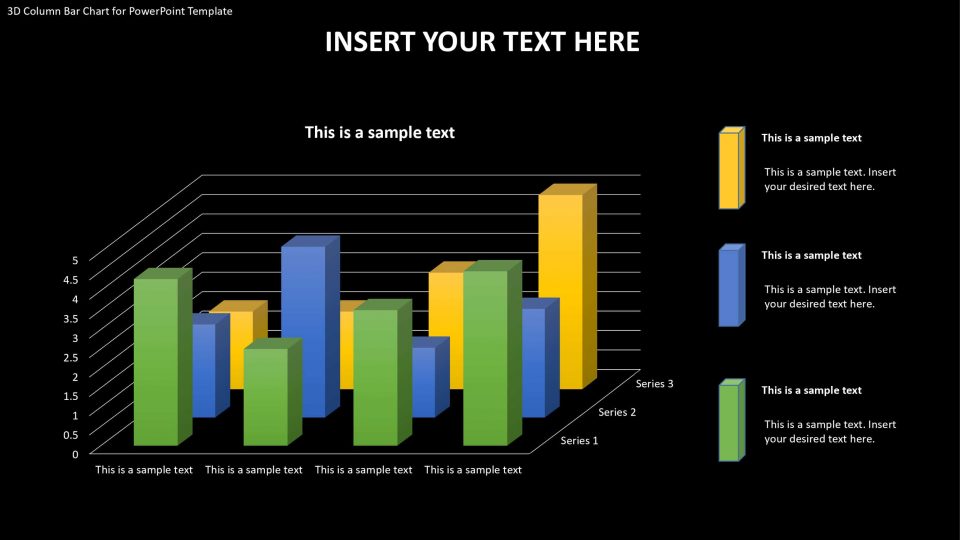
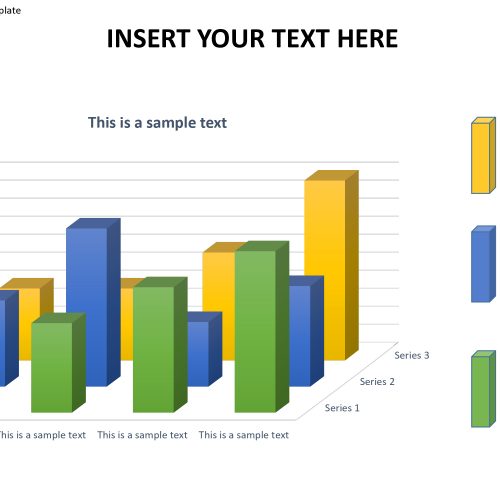
The Analysis Report powerpoint template is a choice of 3D vertical bar outlines that are gathered or bunched together. Brilliant and exquisite, the slide plans can clearly awe proficient crowds. The keen intrigue of the design can invigorate consideration and cognizant learning.
The PowerPoint format is ideal for information driven introductions, for example, showcasing and deals. It is really nonexclusive which implies that any topic can be connected. It very well may be utilized in research introductions where the client can picture bunched results. It is perfect for insights and stock. Numerous business ideas can discover it amazingly helpful, for example, money related announcing and in gauging systems.
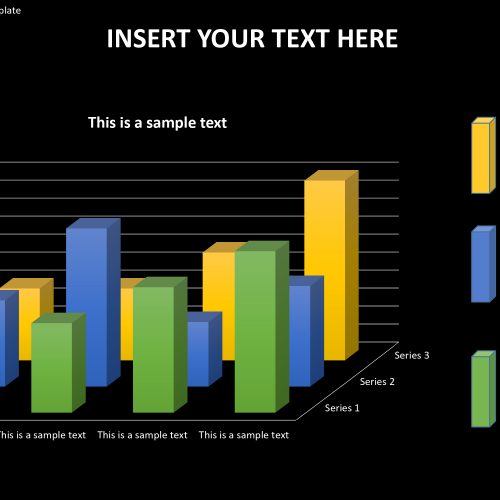
3D Clustered Chart Template for PowerPoint is made out of 5 novel slides. In the primary slide, a point of view bar chart is shown inside a 3D even network. Each layer of the matrix and each diagram bunch have a relating content placeholder for names. The second slide bunches the information as per shading coding. The foundation is a dim world guide layout. The hues can symbolize a specific homogeneous accumulation. The third slide accumulates all bar diagrams in a single plane. In the fourth slide, the moderator can enter in significant portrayals on the content boxes in respect to each shading. Copy highlights from the second slide are stuck to the last slide. The main distinction is the level white foundation.
Features:
- Completely editable in terms of shape, color, size and text
- This template has a built in color theme which is unaffected by copy-pasting
- Includes an icon family with 135 unique completely editable icons
- Drag and drop image placeholder
- Completely editable (using spreadsheet) data-driven charts for displaying statistics
- Completely editable vector graphics
Supports
Microsoft PowerPoint 2010, 2011, 2013, 2016
MacOffice 2016, MacOffice 365


Be the first to review “Analysis Report for PowerPoint Template”