About this PowerPoint template
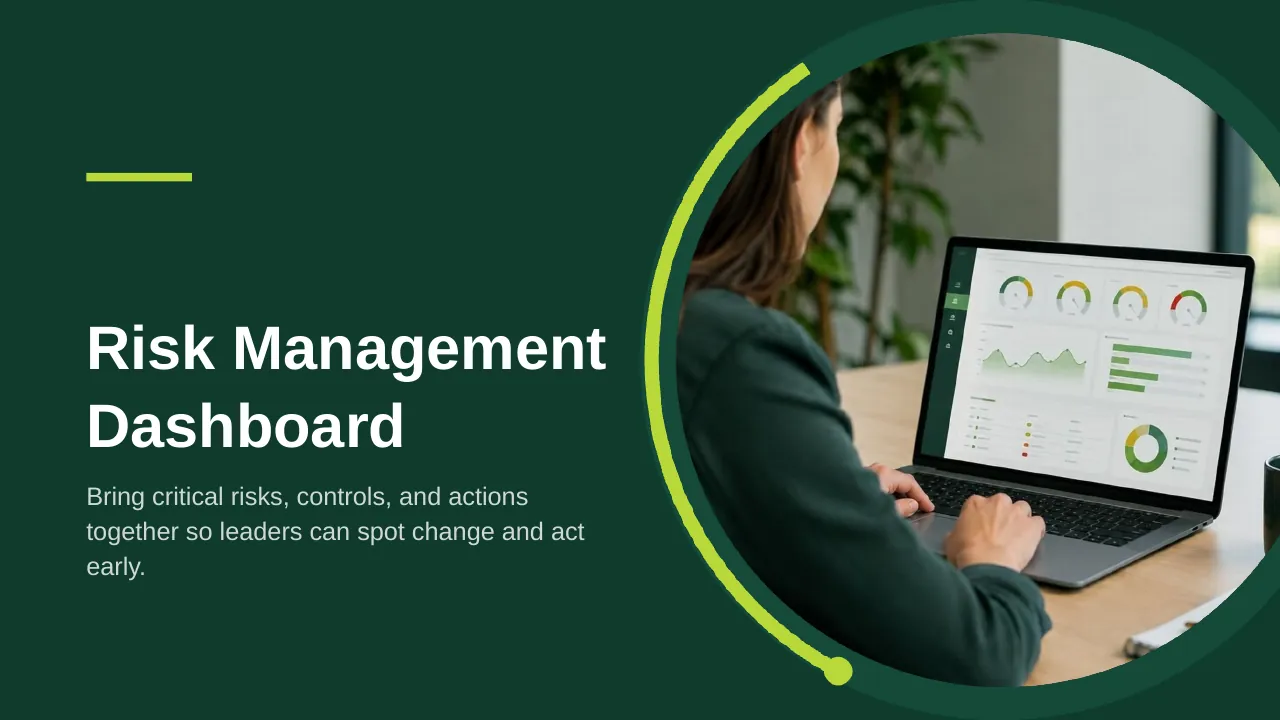
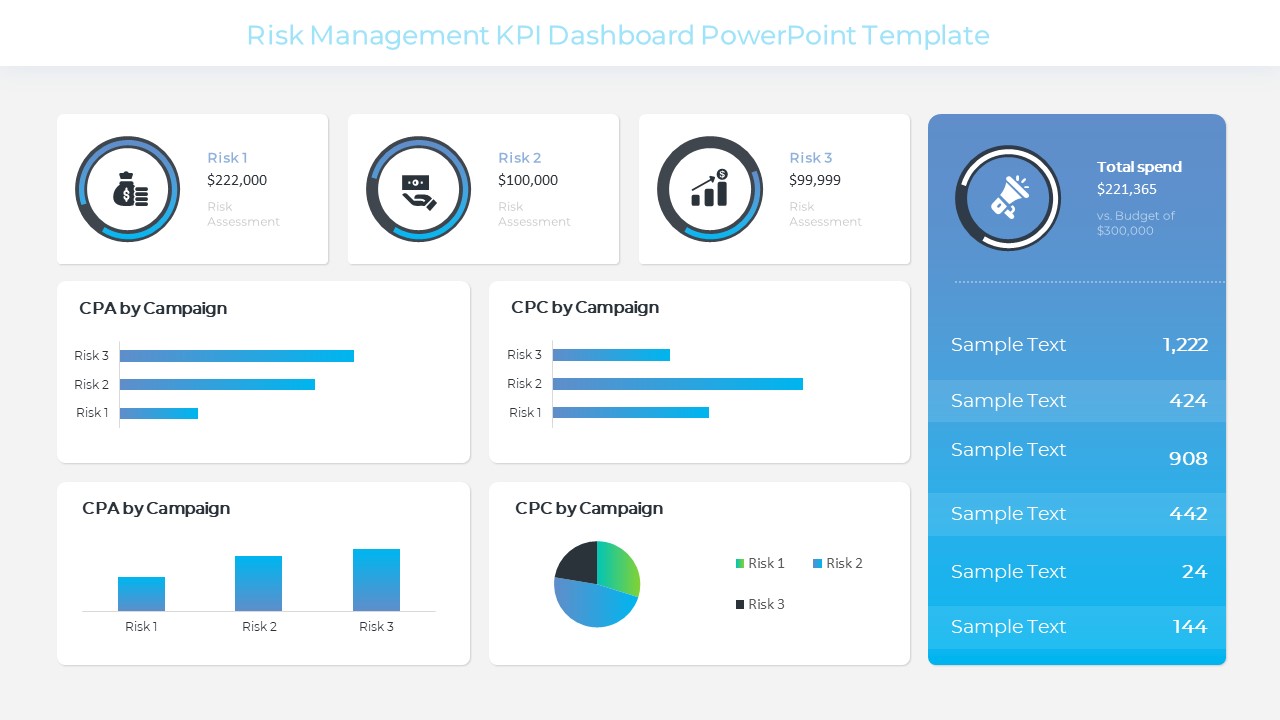
The Risk Management KPI Dashboard PowerPoint Presentation is a complete 25-slide presentation: a practical guide to measuring exposure, controls, and action. Every slide is fully editable in PowerPoint and Google Slides, so you can change the text, colours, charts and icons to fit your brand in minutes.
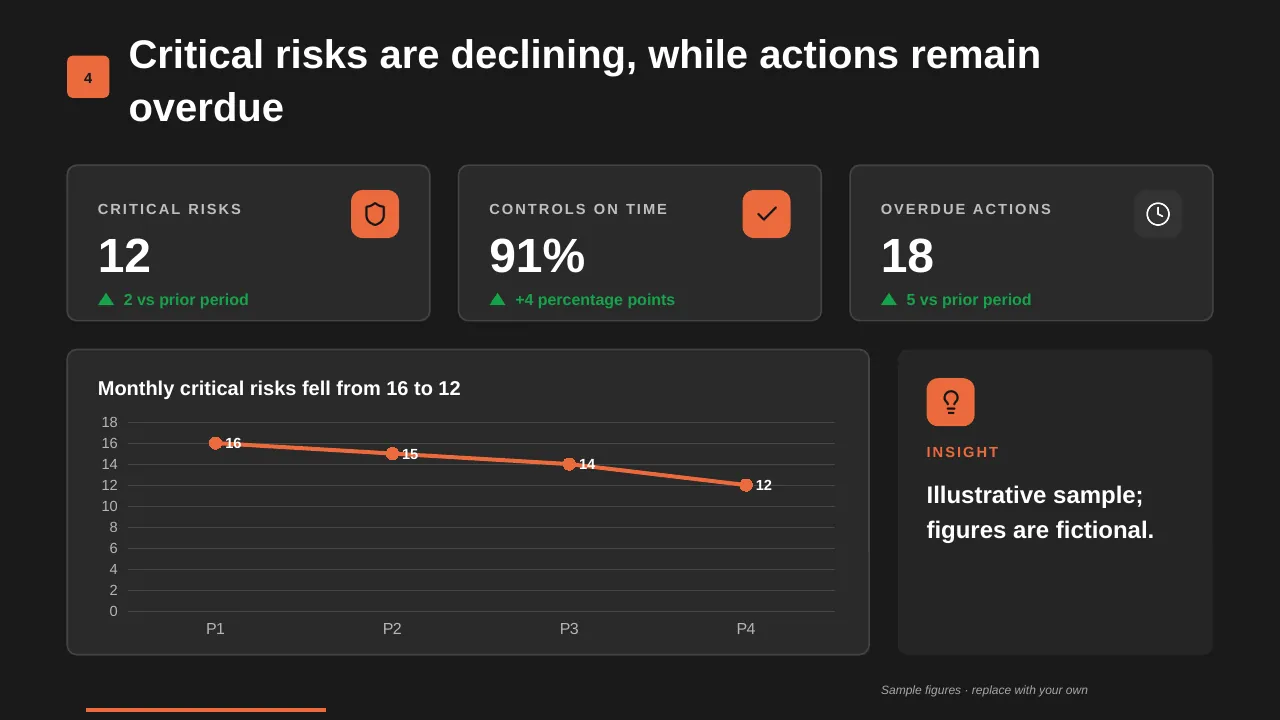
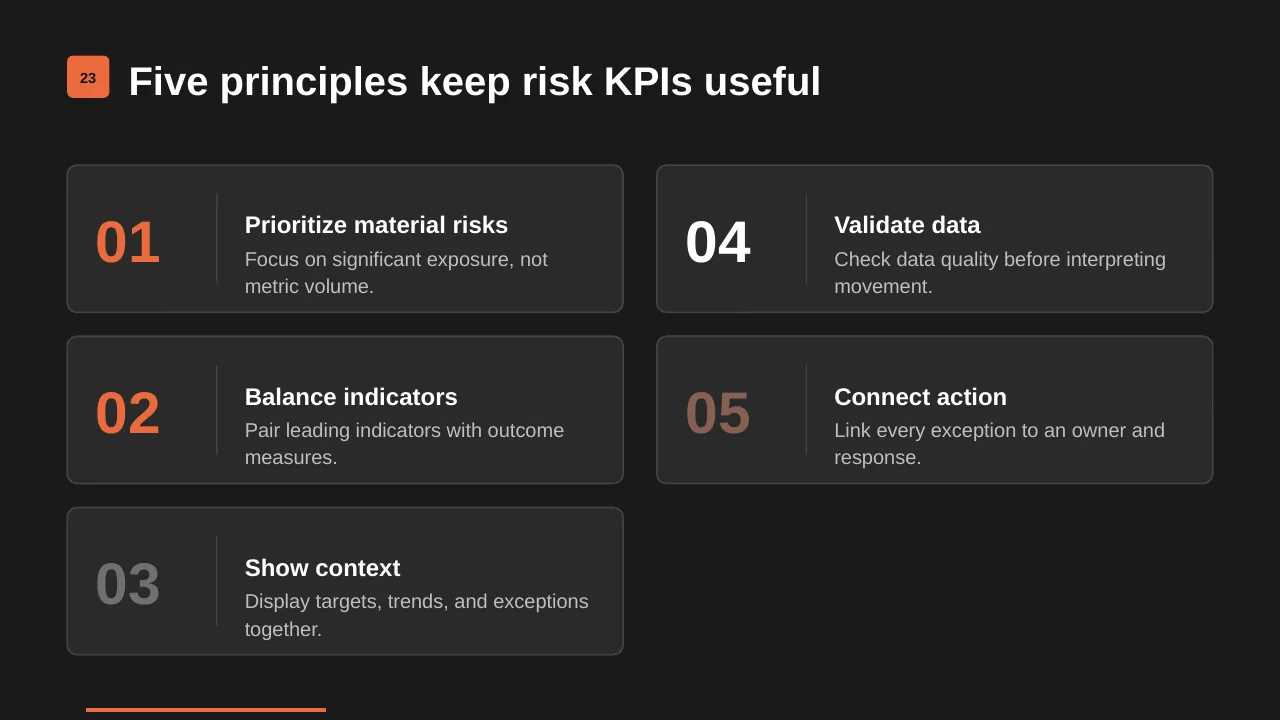
Inside, the slides walk through topics such as “Critical risks are declining, while actions remain overdue”, “Risk reports arrive too late for timely decisions” and “Five principles keep risk KPIs useful”, with ready-made layouts for each step. It is part of our KPI Dashboards presentations.
On this page
What's included
- 25 professionally designed 16:9 widescreen slides
- 100% editable text, shapes, icons, tables and charts (no flat images)
- Works in Microsoft PowerPoint (Windows and Mac) and Google Slides
- Clean, consistent layout that follows your theme colours and fonts
- Delivered as a single ZIP file containing the .pptx presentation
What to include in a risk management presentation
A simple structure that works for most audiences, mapped to the slides in this deck:
| Part | What goes there | Slide in this deck |
|---|---|---|
| Risk appetite | How much risk the organisation will accept | Slides 5, 9 |
| Risk register | Top risks with owners | Slides 3, 4, 5 |
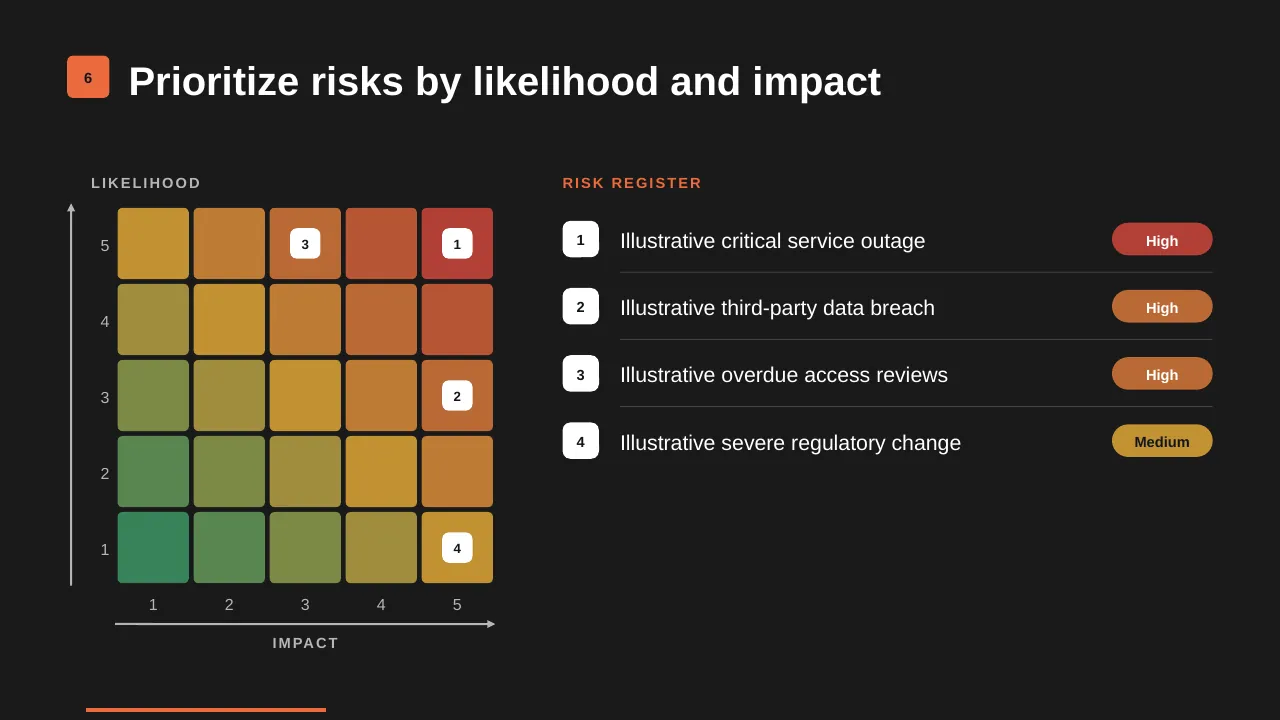
| Assessment | Likelihood and impact heat map | Slides 6, 17 |
| Responses | Mitigations, controls and timelines | Slides 3, 4, 22 |
| Monitoring | KRIs, dashboard and reporting | Slides 2, 3, 14 |
Key numbers: Risk management
Research figures you can quote on your slides. Each one names the study it comes from, so your audience can check it.
| Finding | Figure | Source |
|---|---|---|
| Risk leaders who say timely action on emerging risks is highly important | 72% | Gartner risk leader survey (Q3 2025) |
| Risk leaders confident about what risk information to spotlight | 15% | Gartner risk leader survey (Q3 2025) |
| Business leaders whose risk decisions are strongly shaped by audit, compliance and ERM insight | 30% | Gartner (2026) |
| Audit leaders who say issues are harder to spot before they cause damage | 64% | Gartner audit leader survey (2026) |
Sources: Corporate Compliance Insights on Gartner's risk survey · People Matters on Gartner's 2026 findings · Gartner, Q4 2025 emerging risks. Figures are from the editions named; check for a newer edition before you present.
In Gartner's quarterly surveys through 2025, the top emerging risks were the low-growth economy, trade and tariff tensions, and AI-related governance risks.
Slide-by-slide outline
| Slide | What it covers |
|---|---|
| 1 | Title slide: Risk Management KPI Dashboard |
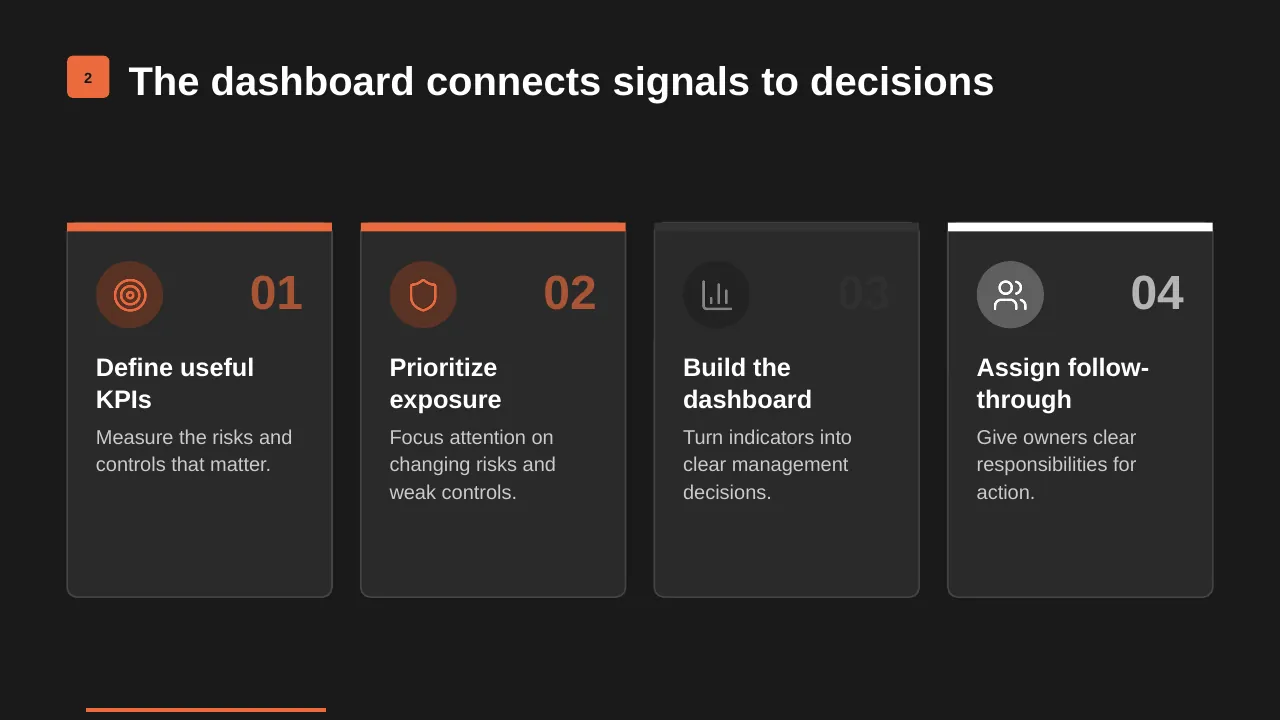
| 2 | The dashboard connects signals to decisions |
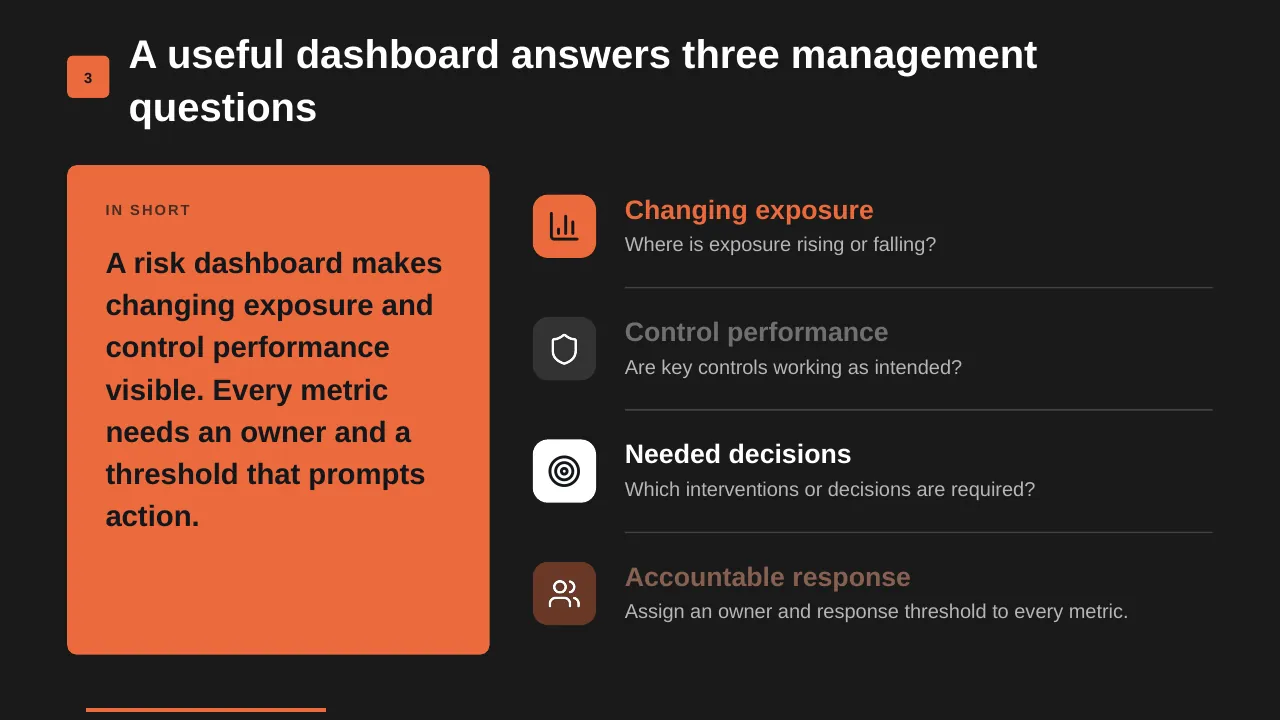
| 3 | A risk dashboard makes changing exposure and control performance visible. Every metric needs an owner and… |
| 4 | Critical risks are declining, while actions remain overdue |
| 5 | Separate exposure from activity, link indicators to objectives, and focus on changing risks. |
| 6 | Prioritize risks by likelihood and impact |
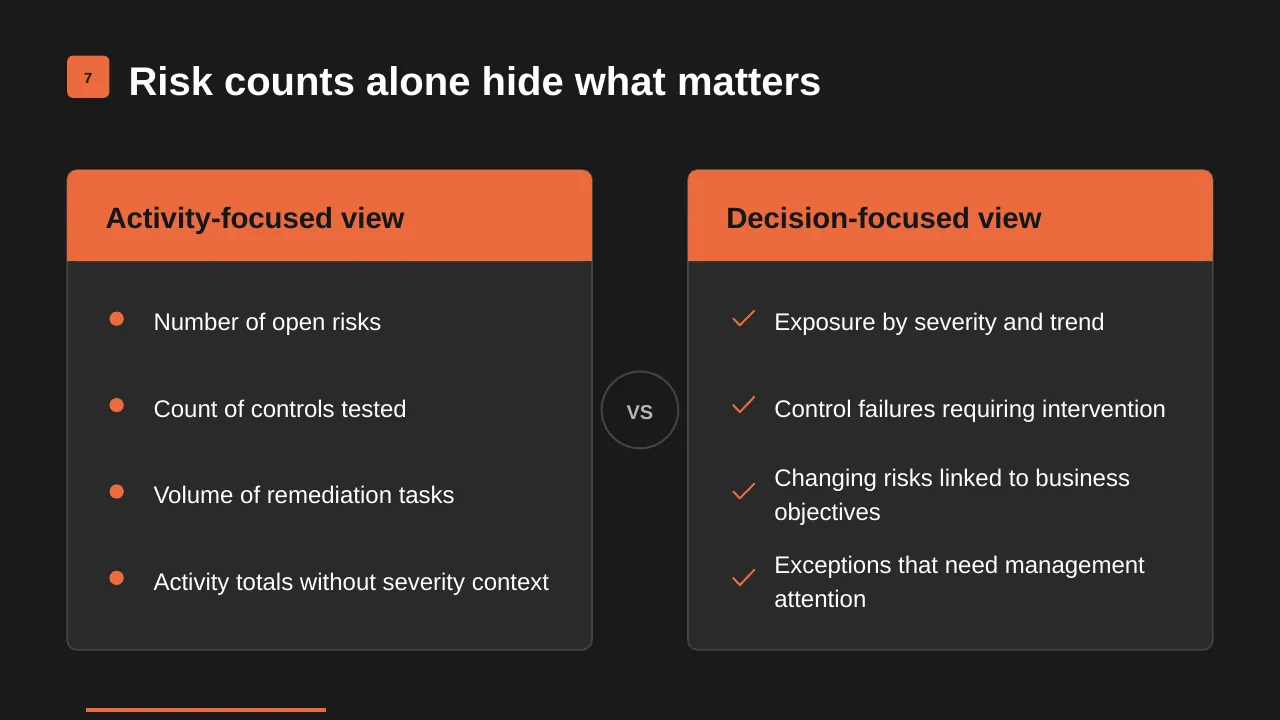
| 7 | Risk counts alone hide what matters |
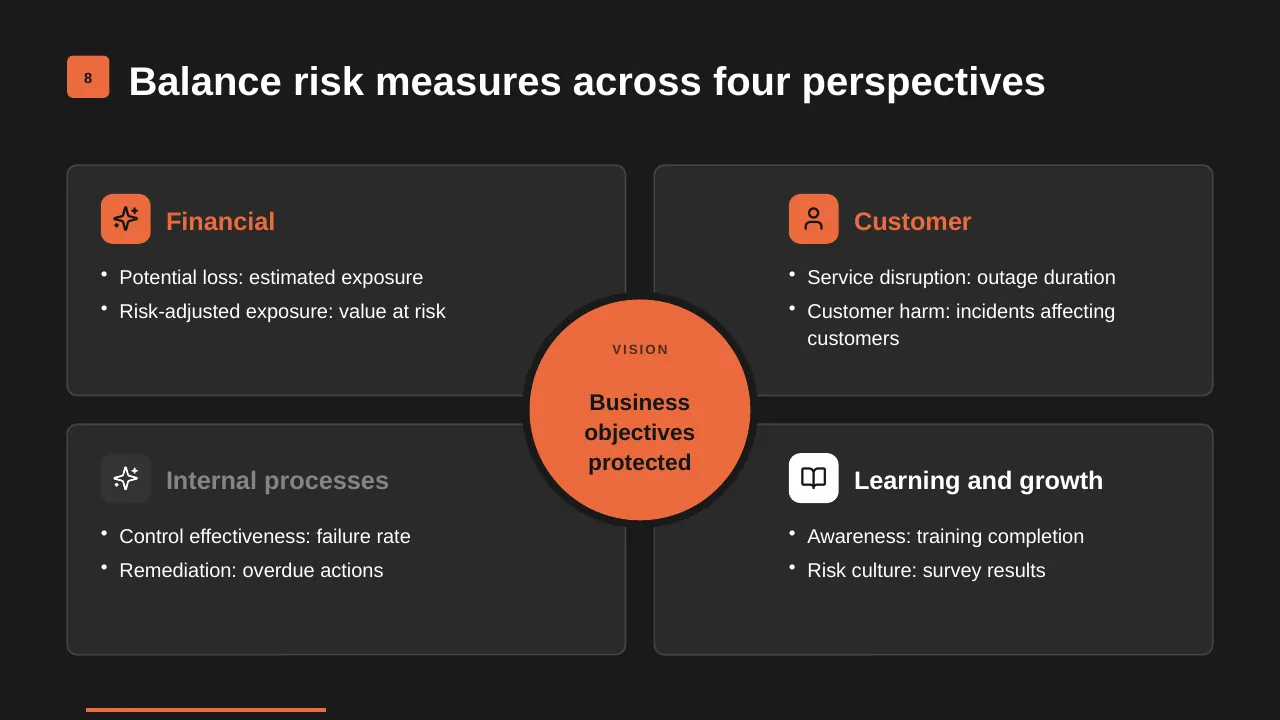
| 8 | Potential loss: estimated exposure Risk-adjusted exposure: value at risk |
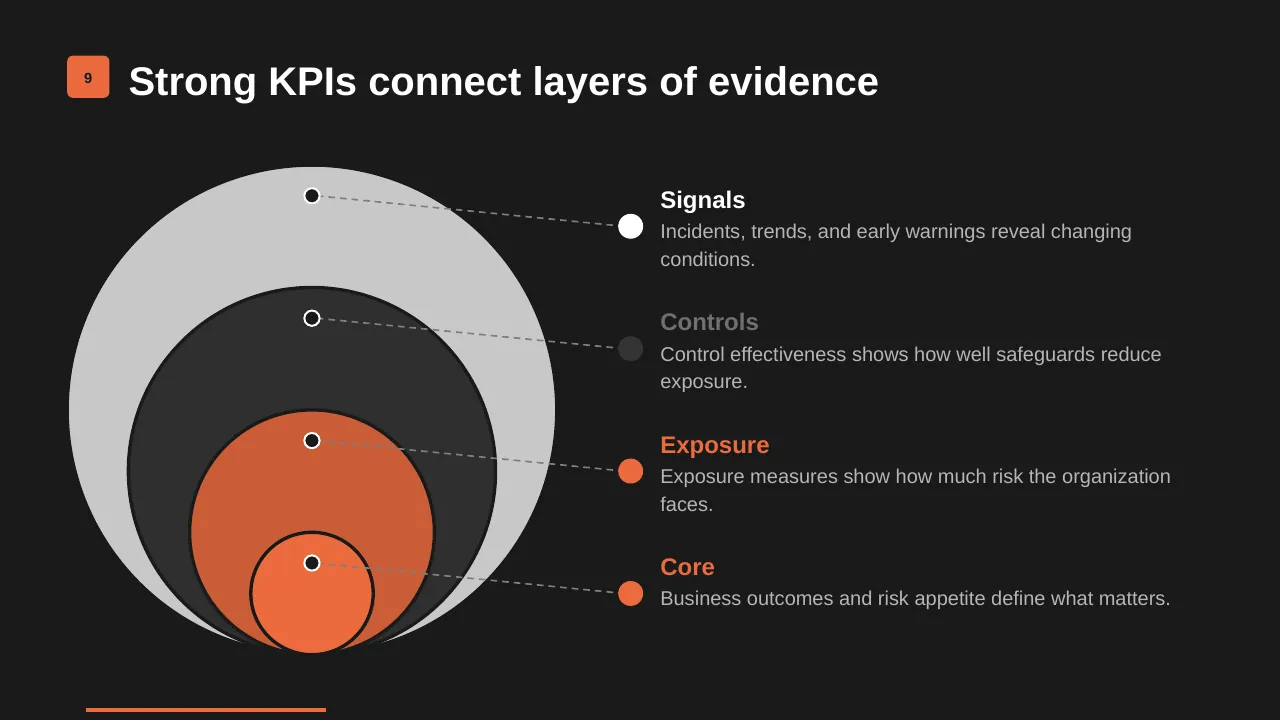
| 9 | Business outcomes and risk appetite define what matters. |
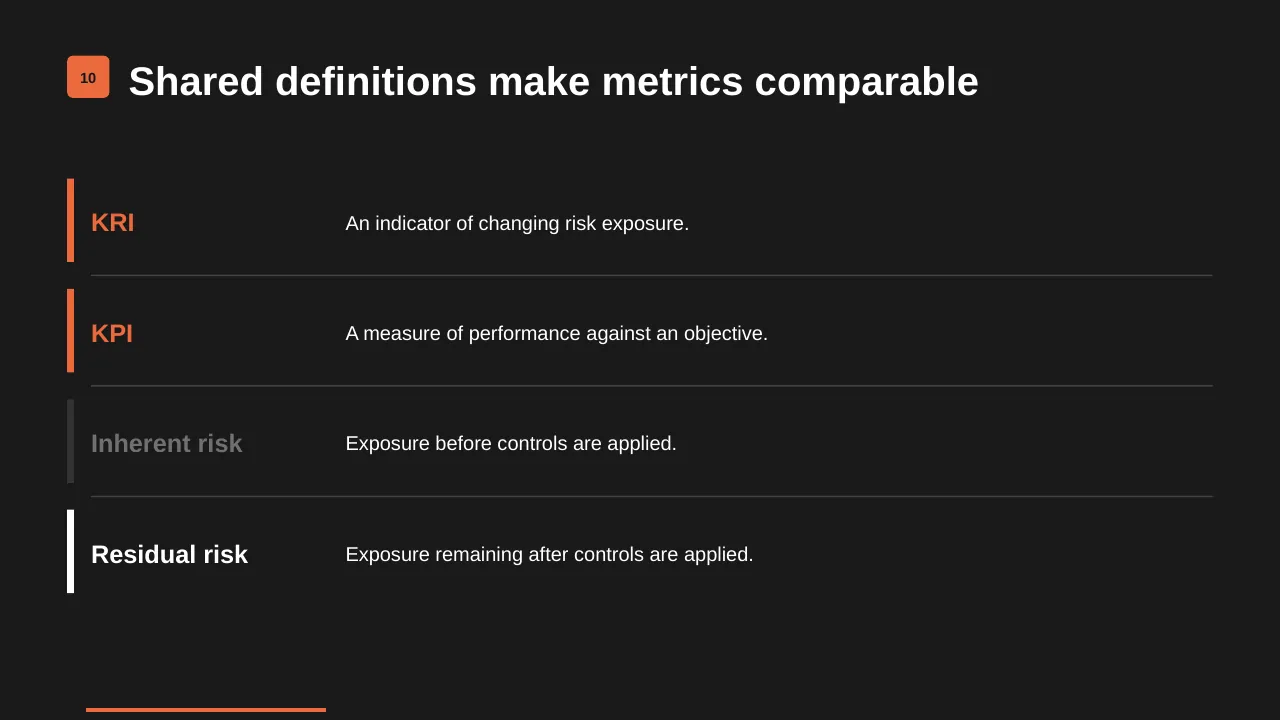
| 10 | Shared definitions make metrics comparable |
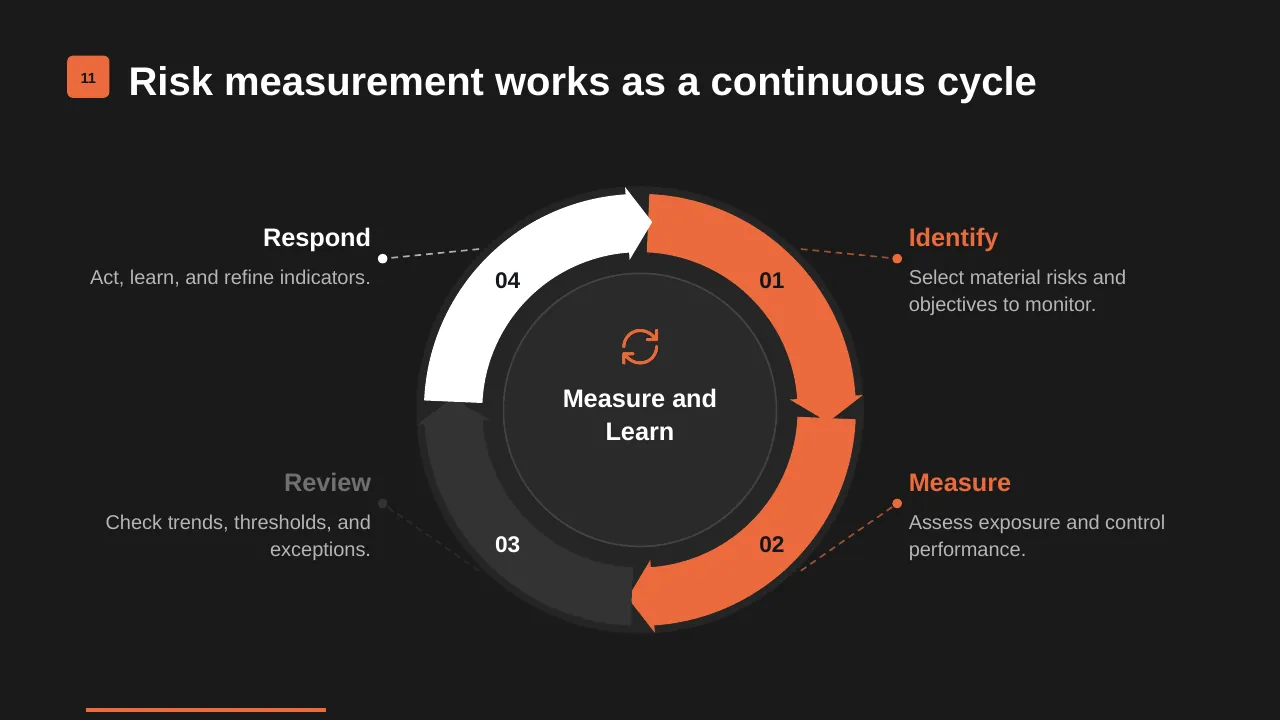
| 11 | Risk measurement works as a continuous cycle |
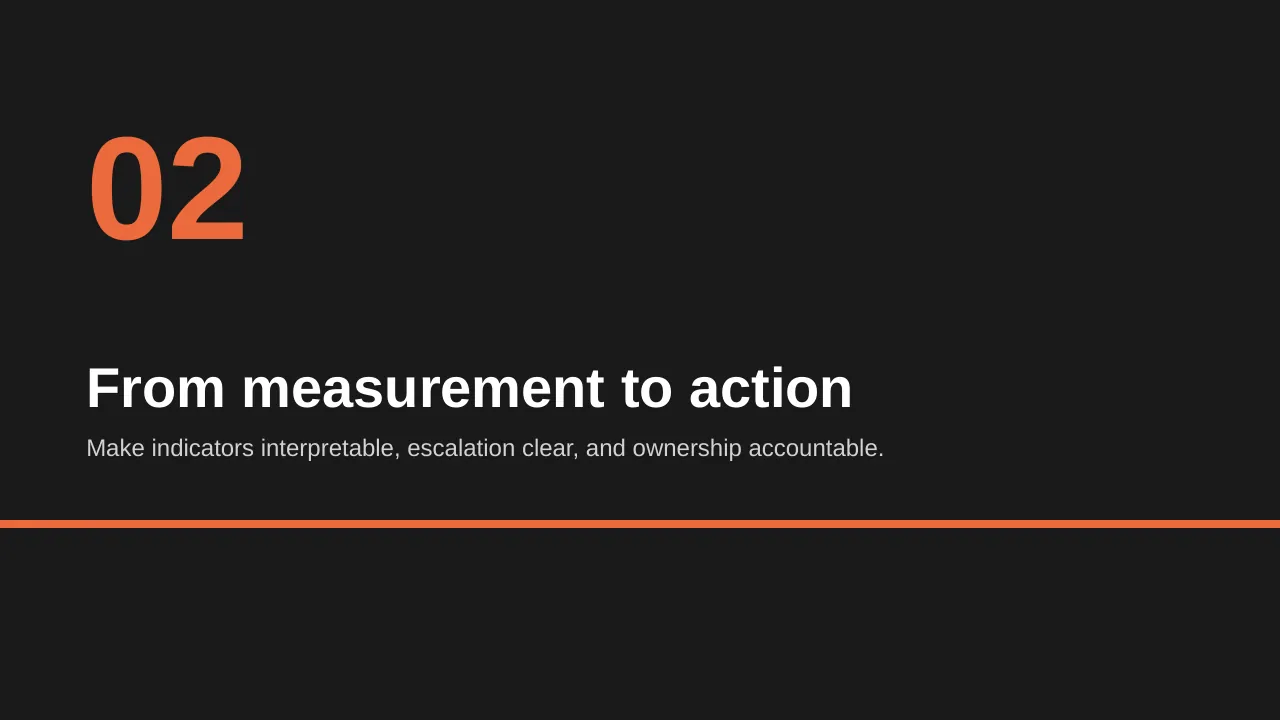
| 12 | Make indicators interpretable, escalation clear, and ownership accountable. |
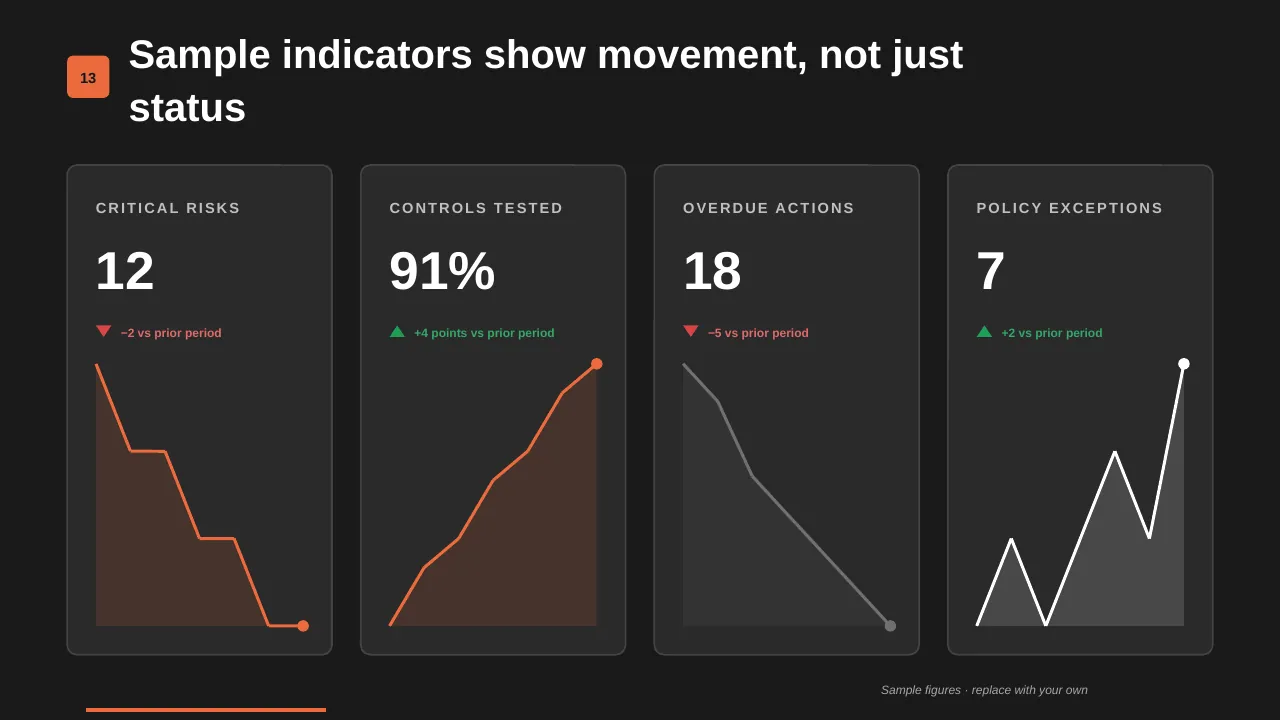
| 13 | Sample indicators show movement, not just status |
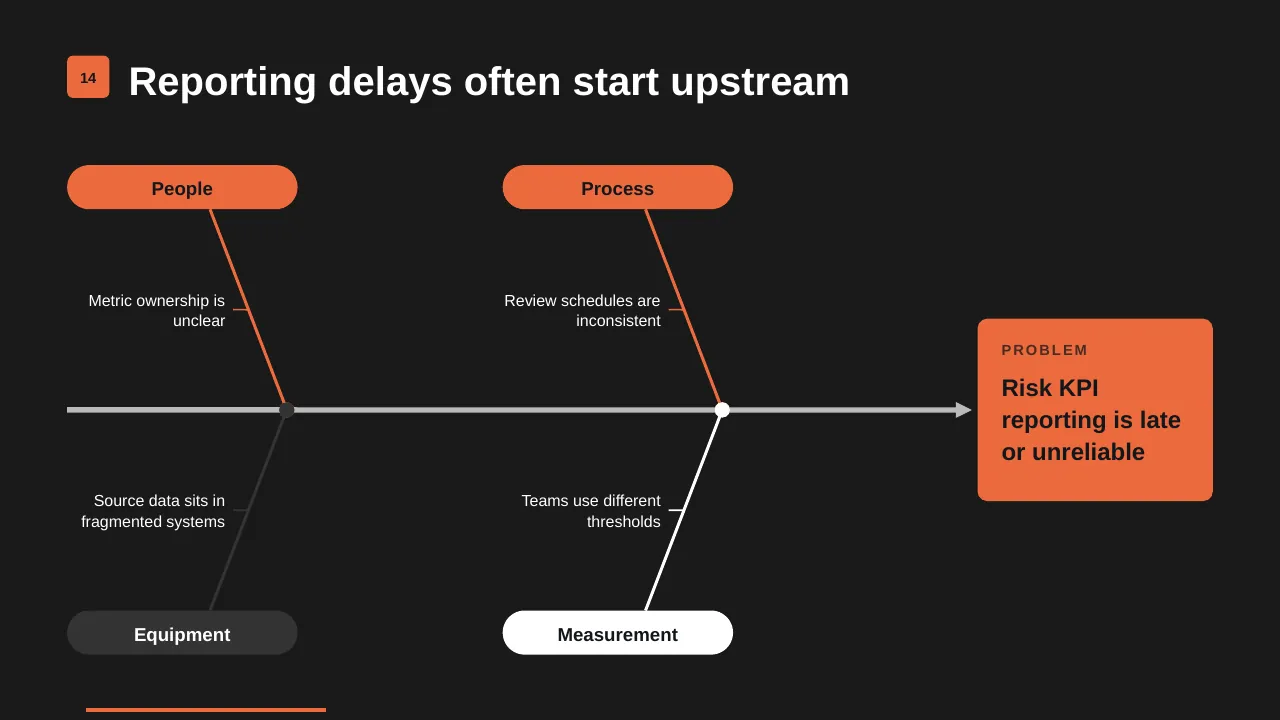
| 14 | Risk KPI reporting is late or unreliable |
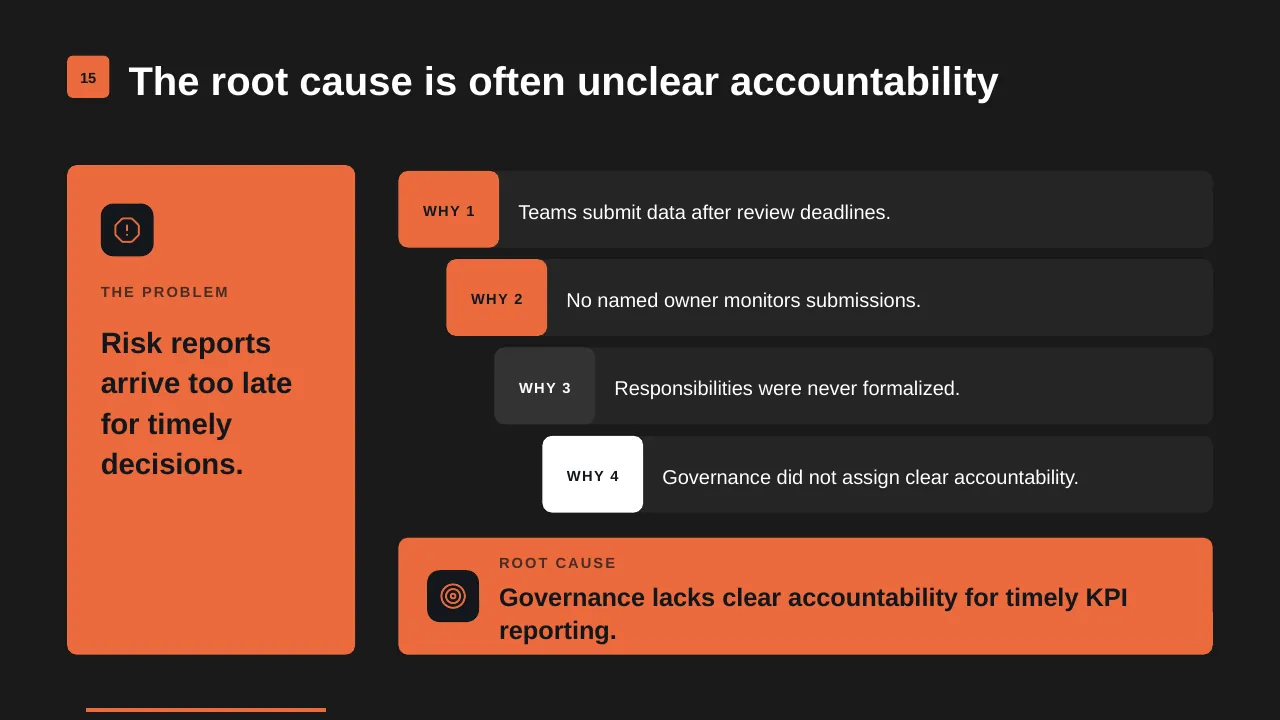
| 15 | Risk reports arrive too late for timely decisions. |
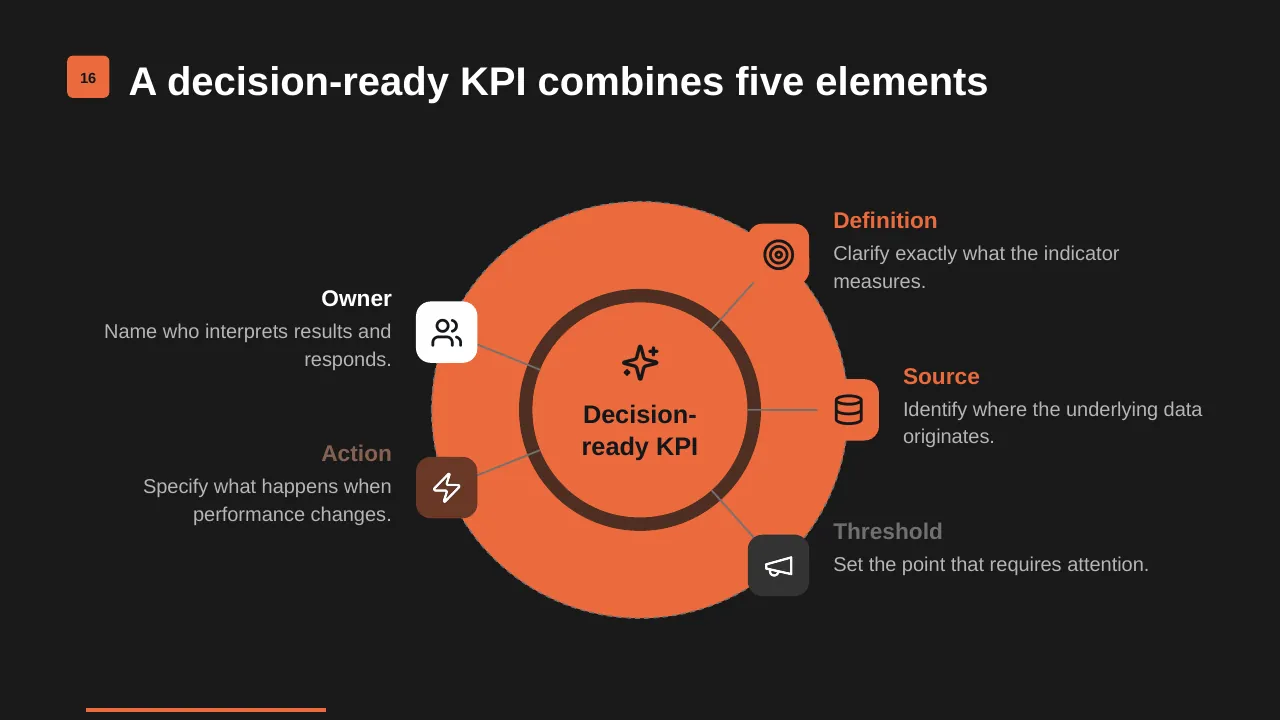
| 16 | A decision-ready KPI combines five elements |
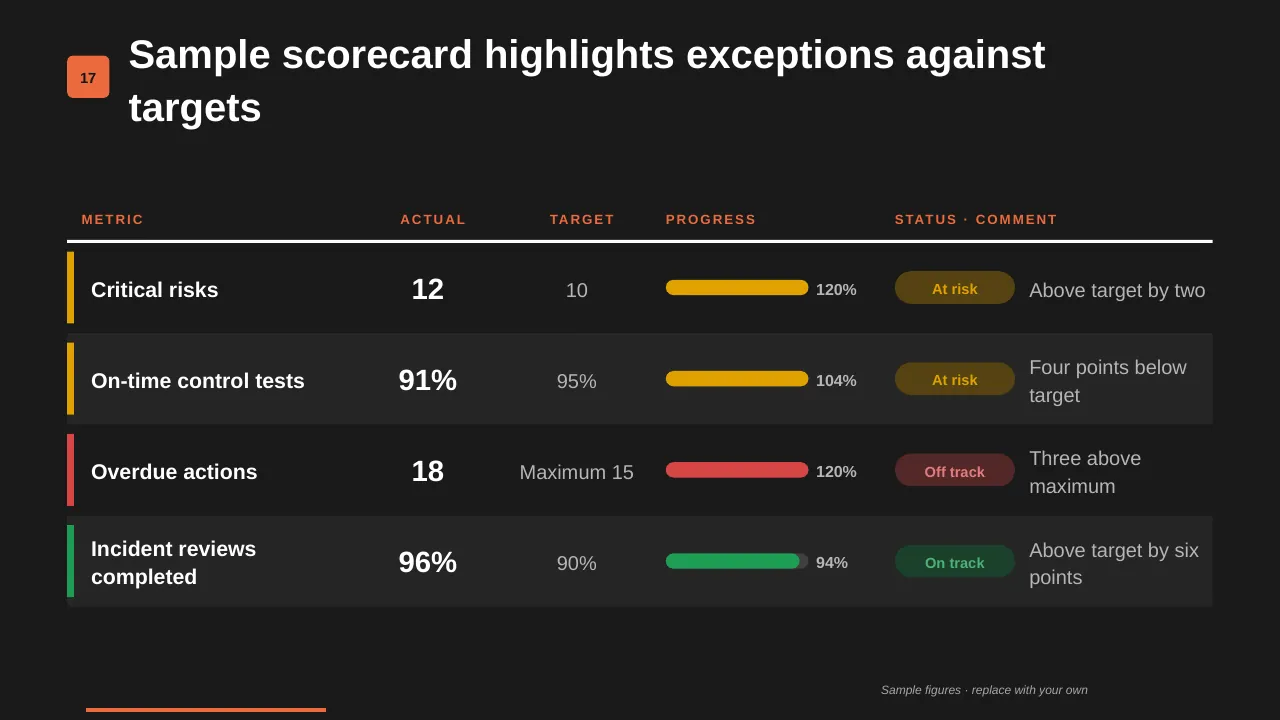
| 17 | Sample scorecard highlights exceptions against targets |
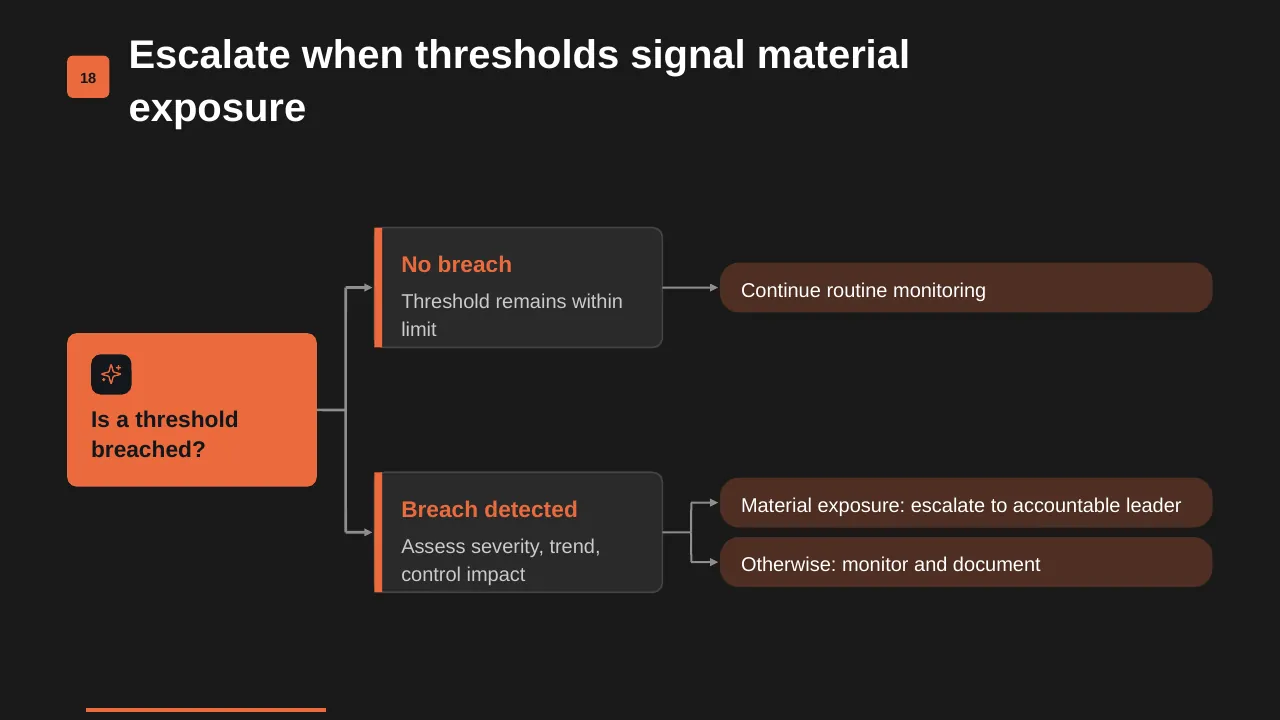
| 18 | Escalate when thresholds signal material exposure |
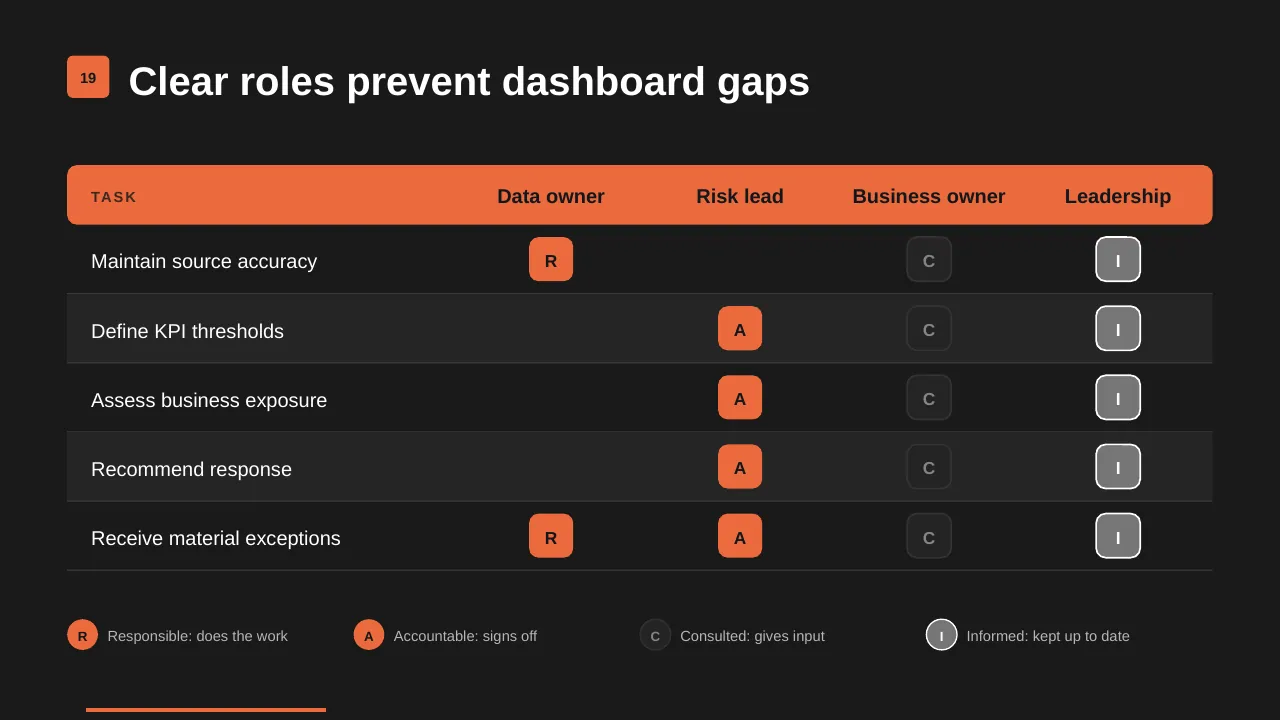
| 19 | Clear roles prevent dashboard gaps |
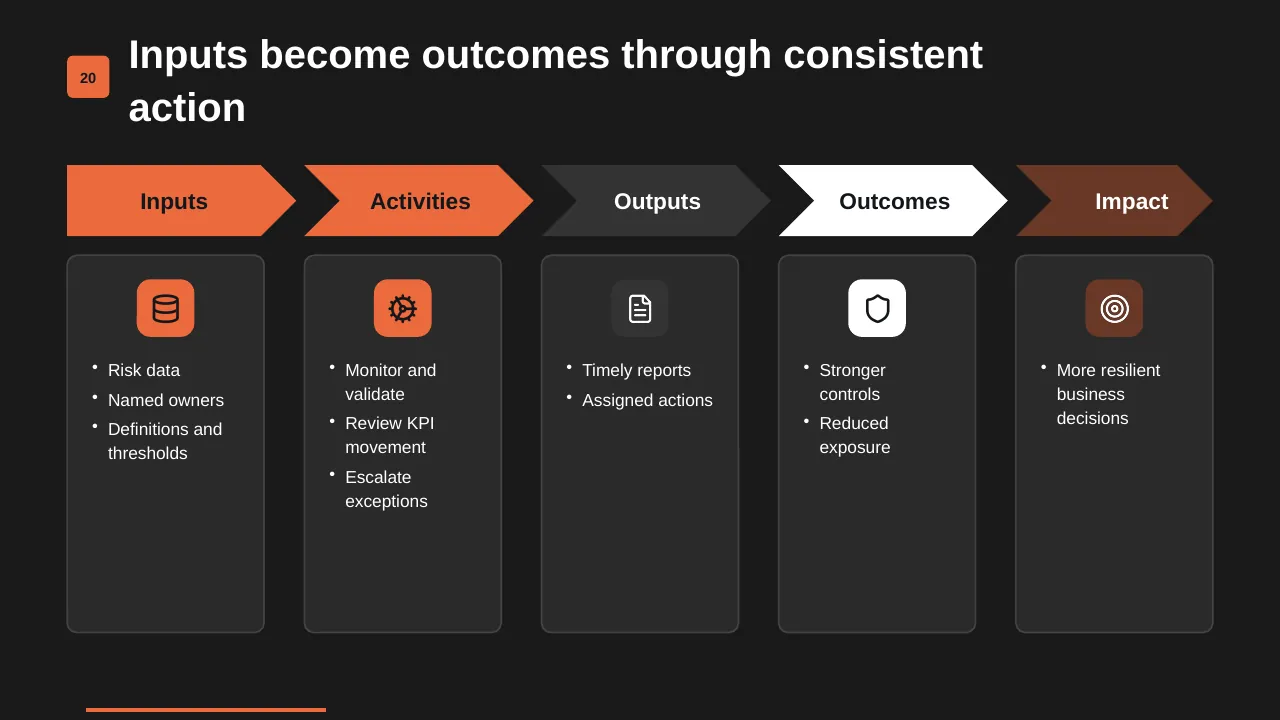
| 20 | Risk data Named owners Definitions and thresholds |
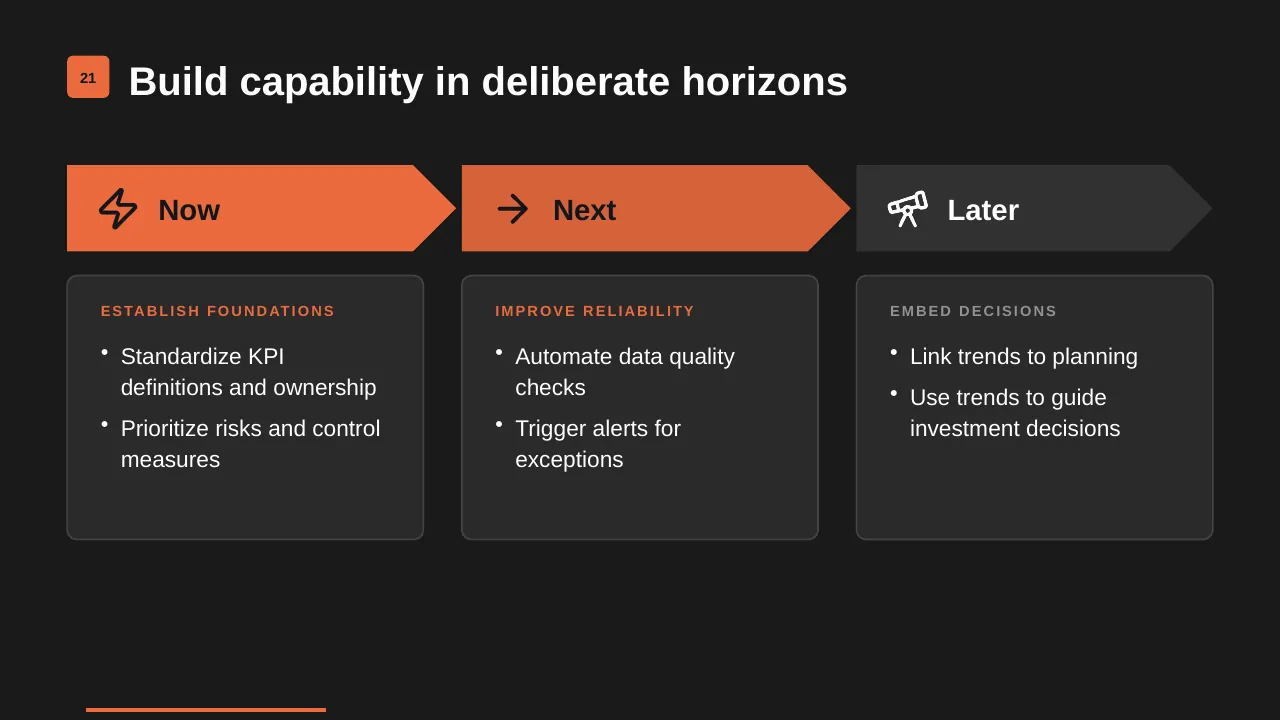
| 21 | Build capability in deliberate horizons |
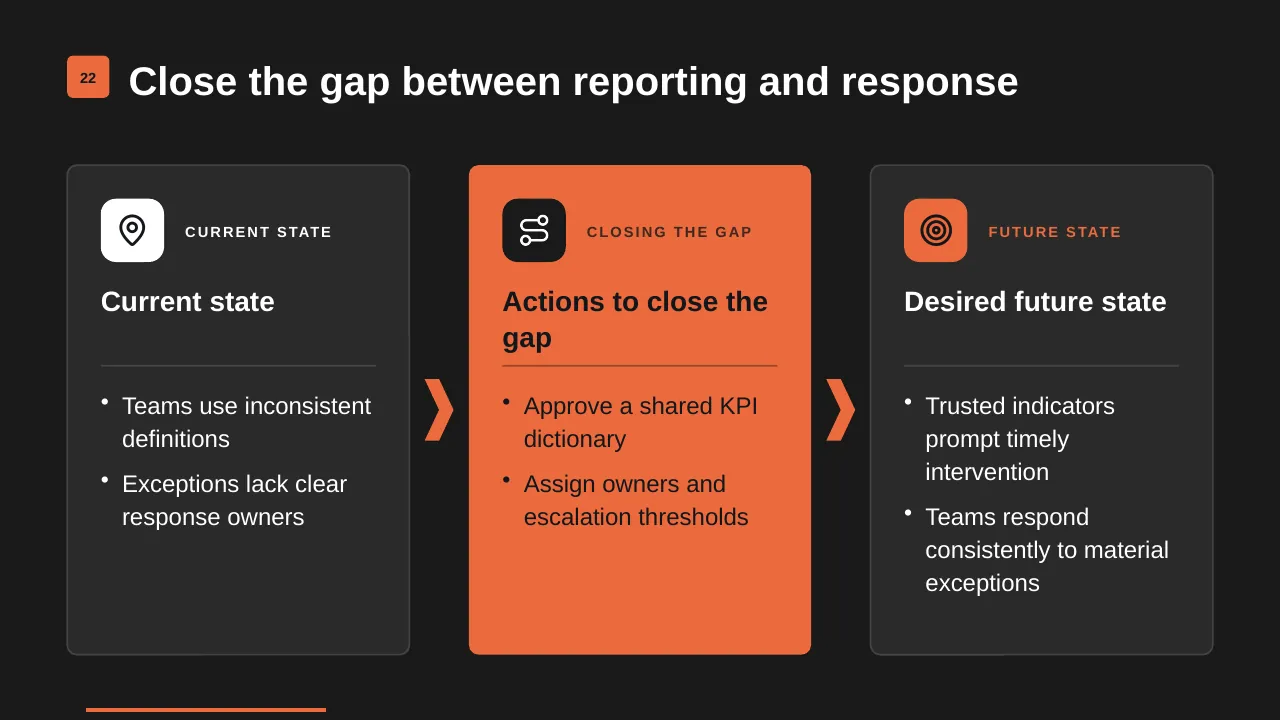
| 22 | Close the gap between reporting and response |
| 23 | Five principles keep risk KPIs useful |
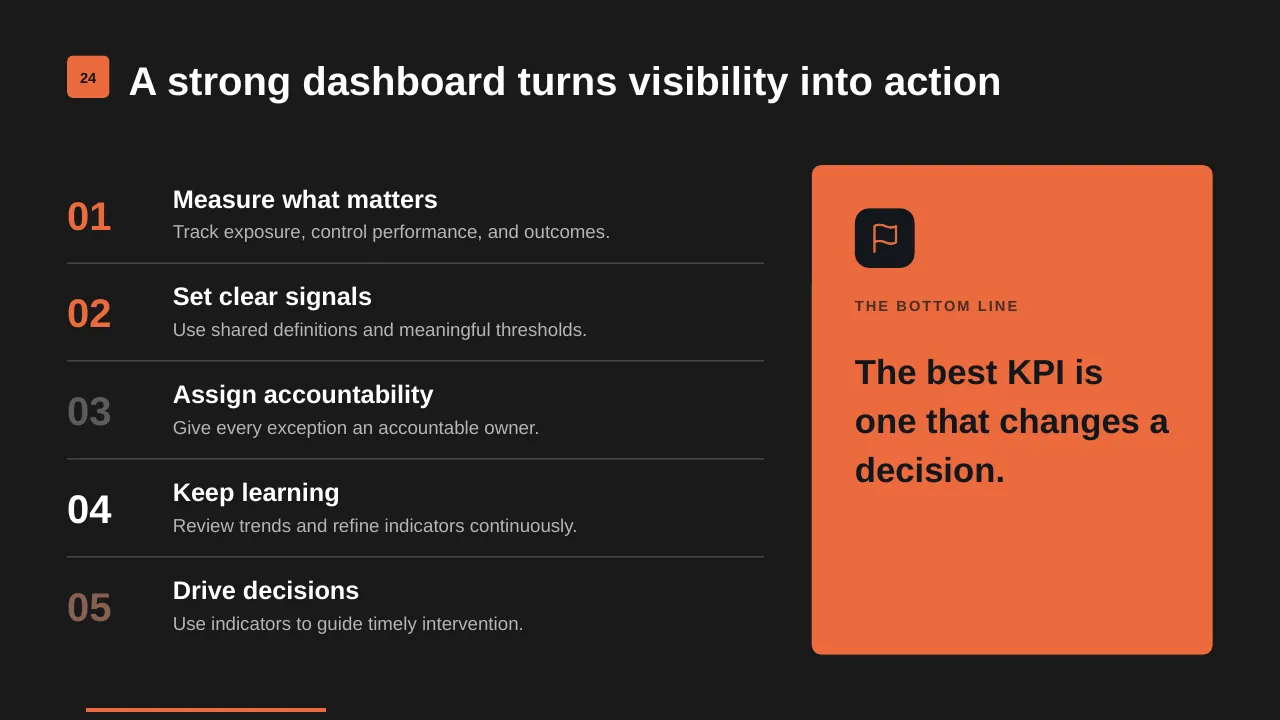
| 24 | A strong dashboard turns visibility into action |
| 25 | Select priority risks, assign owners and thresholds, then review the dashboard with decision-makers. |
Tips for a risk management presentation
- Show the top five to ten risks, not the full register.
- Use a heat map so priorities are visible.
- Give every risk an owner and a next step.
- Include emerging risks such as AI or trade changes.
Mistakes to avoid
- Long risk lists with no priorities
- Risks without owners
- Static registers that never change
Checklist before you present
- Is risk appetite stated?
- Are top risks prioritised?
- Does each have an owner?
- Are responses dated?
- Are KRIs tracked?
Great for
- Monthly performance reviews
- Management and board reporting
- Project and portfolio tracking
- HR, finance and operations metrics
How to customise it
- Download the ZIP file and unzip it to get the .pptx presentation.
- Open it in PowerPoint, or upload it to Google Drive and open it with Google Slides.
- Replace the sample text and numbers with your own; charts update from their data sheets.
- Change the theme colours once to recolour the whole deck, then delete any slides you don't need.
Questions about a risk management presentation
What is the difference between a KPI and a KRI?
A KPI measures performance; a KRI (key risk indicator) is an early warning that a risk is becoming more likely or severe.
What is enterprise risk management?
A company-wide approach to identifying, assessing and managing risks so they are handled consistently and within an agreed appetite.
Related presentations
- Actual vs Budgeted Revenue Dashboard PowerPoint Template
- Agile HR Transformation KPI Dashboard PowerPoint Template
- Supply Chain Management Dashboard PowerPoint Template
- Recruitment KPI Dashboard PowerPoint Template
Browse all KPI Dashboards presentations or more dashboard templates.
Template details
| Template | Risk Management KPI Dashboard PowerPoint Presentation |
|---|---|
| Categories | Dashboards, KPI Dashboards |
| File format | PowerPoint (.pptx), delivered as a .zip file |
| Number of slides | 25 fully editable slides |
| File size | 2.2 MB |
| Slide size | 16:9 widescreen |
| Preview images | 25 |
| Editable | Yes: text, colours, shapes, icons and charts |
| Works with | PowerPoint 2010 and later, PowerPoint for Mac, Google Slides |
| Licence | Royalty-free, yours to keep using after your plan ends (terms of use apply) |
| Price | Included in every SlideVilla plan |
| Added | 26 Sept 2025 |
Questions about this template
Can I edit the Risk Management KPI Dashboard PowerPoint Presentation?
Yes. Every part of the Risk Management KPI Dashboard PowerPoint Presentation is made with native PowerPoint shapes and text boxes, so you can change the wording, colours, fonts and sizes, move or delete elements, and swap icons without losing quality.
Does the Risk Management KPI Dashboard PowerPoint Presentation work in Google Slides?
Yes. Download the .zip file, unzip it to get the .pptx, upload it to Google Drive and open it with Google Slides. The layout, shapes and text stay editable there too.
Is the Risk Management KPI Dashboard PowerPoint Presentation free?
It is a premium template, included in every SlideVilla plan together with the rest of the library. See plans and pricing.
What size and format is it?
It is a PPTX file in 16:9 widescreen format with 25 slides, 2.2 MB (downloaded as a .zip; unzip it to get the presentation), with 25 preview images shown above.
How to use this template
- Step 1DownloadClick Download, then unzip the .zip file to get the .pptx presentation.
- Step 2OpenOpen it in PowerPoint, or upload it to Google Slides from your Drive.
- Step 3Make it yoursChange text, colours, icons and charts. Every element is fully editable.
Categories
Related PowerPoint templates
More designs like this one, ready to edit.