About this PowerPoint template
The Project Management Timeline Gantt Chart PowerPoint Template is a complete 25-slide presentation: coordinate work, ownership, and delivery with a shared schedule. Every slide is fully editable in PowerPoint and Google Slides, so you can change the text, colours, charts and icons to fit your brand in minutes.
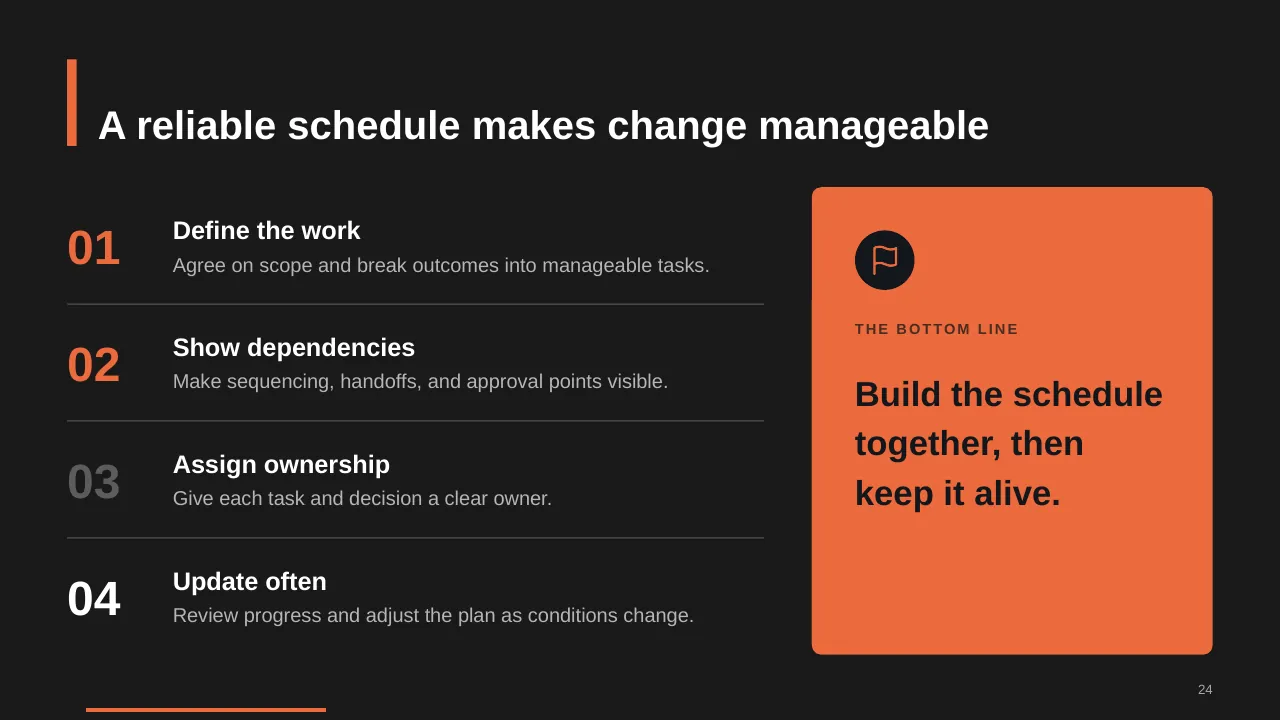
Inside, the slides walk through topics such as “Clarify scope, assumptions, and work before setting dates”, “Manage schedule risks before they become delays” and “A reliable schedule makes change manageable”, with ready-made layouts for each step. It is part of our Roadmaps & Timelines presentations.
On this page
What's included
- 25 professionally designed 16:9 widescreen slides
- 100% editable text, shapes, icons, tables and charts (no flat images)
- Works in Microsoft PowerPoint (Windows and Mac) and Google Slides
- Clean, consistent layout that follows your theme colours and fonts
- Delivered as a single ZIP file containing the .pptx presentation
What to include in a roadmap or timeline
A simple structure that works for most audiences, mapped to the slides in this deck:
| Part | What goes there | Slide in this deck |
|---|---|---|
| Goal | What the roadmap delivers overall | Use any content slide |
| Timeline | Phases, quarters or years | Slides 5, 12, 13 |
| Workstreams | Swimlanes for teams or themes | Slides 14, 15, 18 |
| Milestones | Key dates and deliverables | Slides 7, 10, 11 |
| Dependencies and risks | What must happen first, and what could slip | Slides 3, 4, 7 |
Key numbers: Strategy execution
Research figures you can quote on your slides. Each one names the study it comes from, so your audience can check it.
| Finding | Figure | Source |
|---|---|---|
| Firms that struggle to bridge strategy and day-to-day implementation | 61% | Economist Intelligence Unit for PMI (2013) |
| Strategic initiatives that did not succeed over three years | 44% | Economist Intelligence Unit for PMI (2013) |
| Strategic initiatives that succeed when projects are highly aligned to strategy vs poorly | 65% vs 35% | PMI Pulse of the Profession (2014) |
| Leaders naming leadership buy-in as the top reason initiatives succeed | 51% | Economist Intelligence Unit for PMI (2013) |
Sources: PMI and EIU, Why Good Strategies Fail (press release) · PMI, Bridging the chasm. Figures are from the editions named; check for a newer edition before you present.
Slide-by-slide outline
| Slide | What it covers |
|---|---|
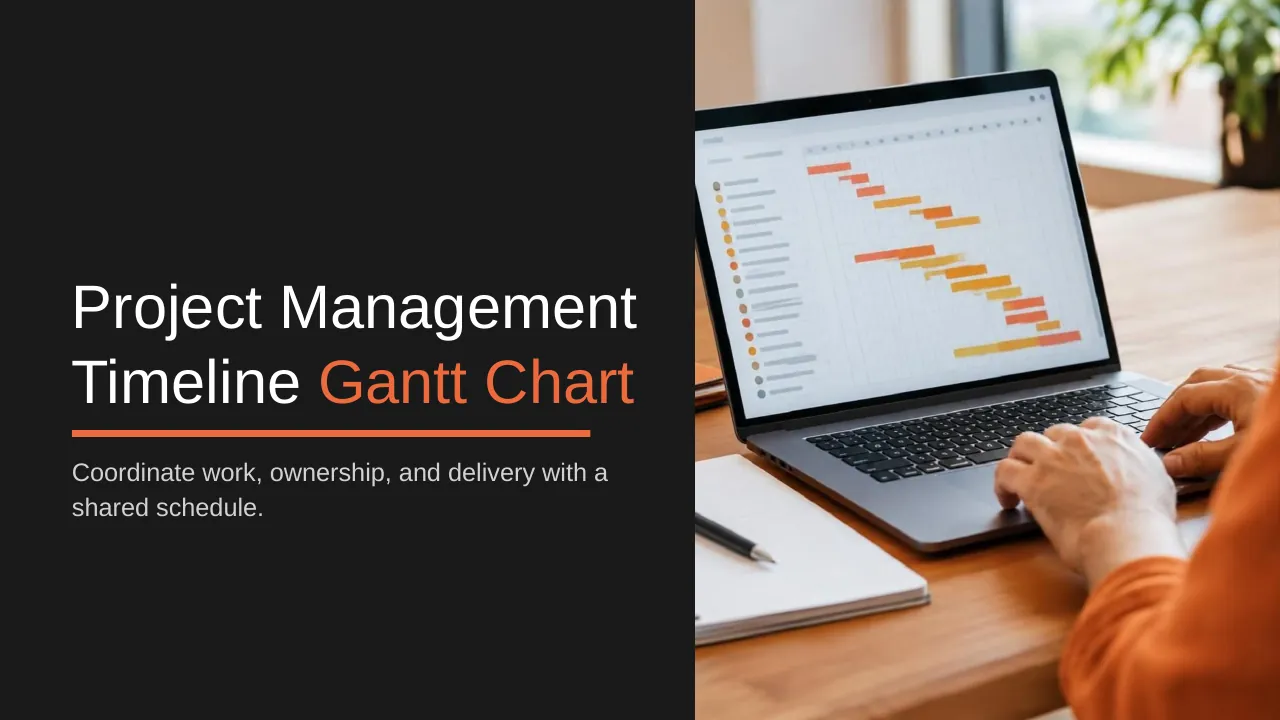
| 1 | Title slide: Project Management Timeline Gantt Chart |
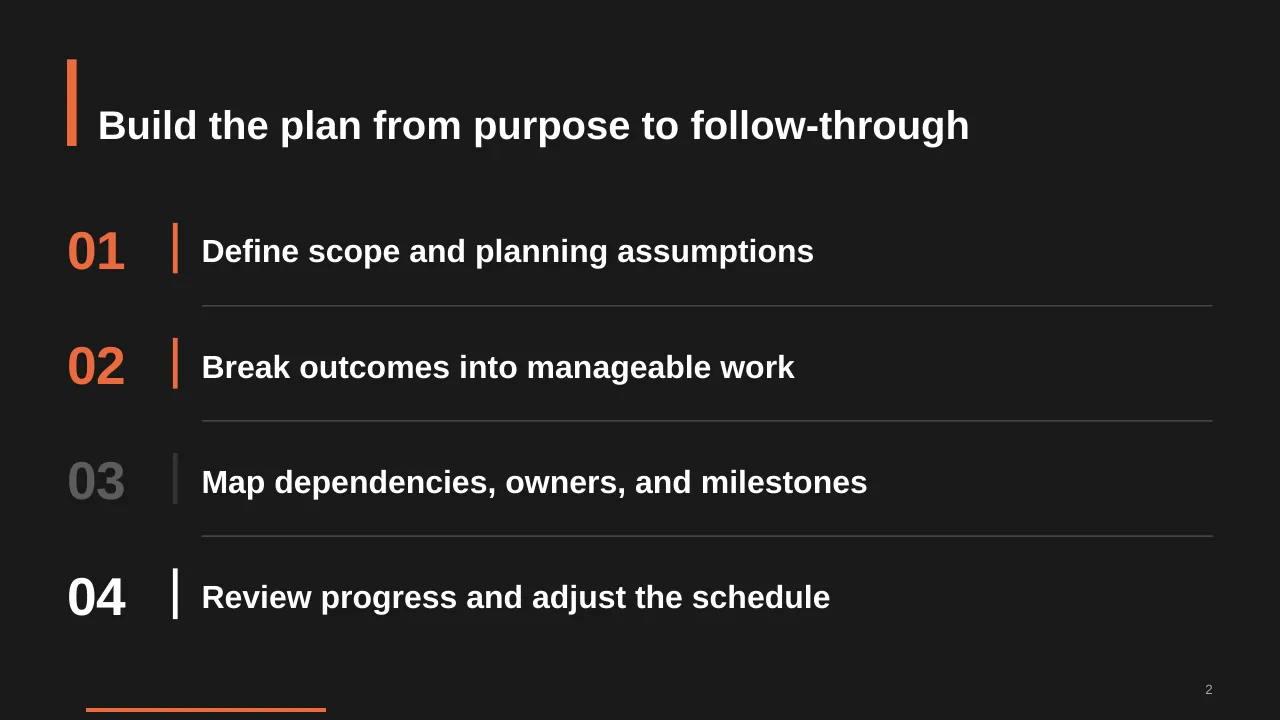
| 2 | Build the plan from purpose to follow-through |
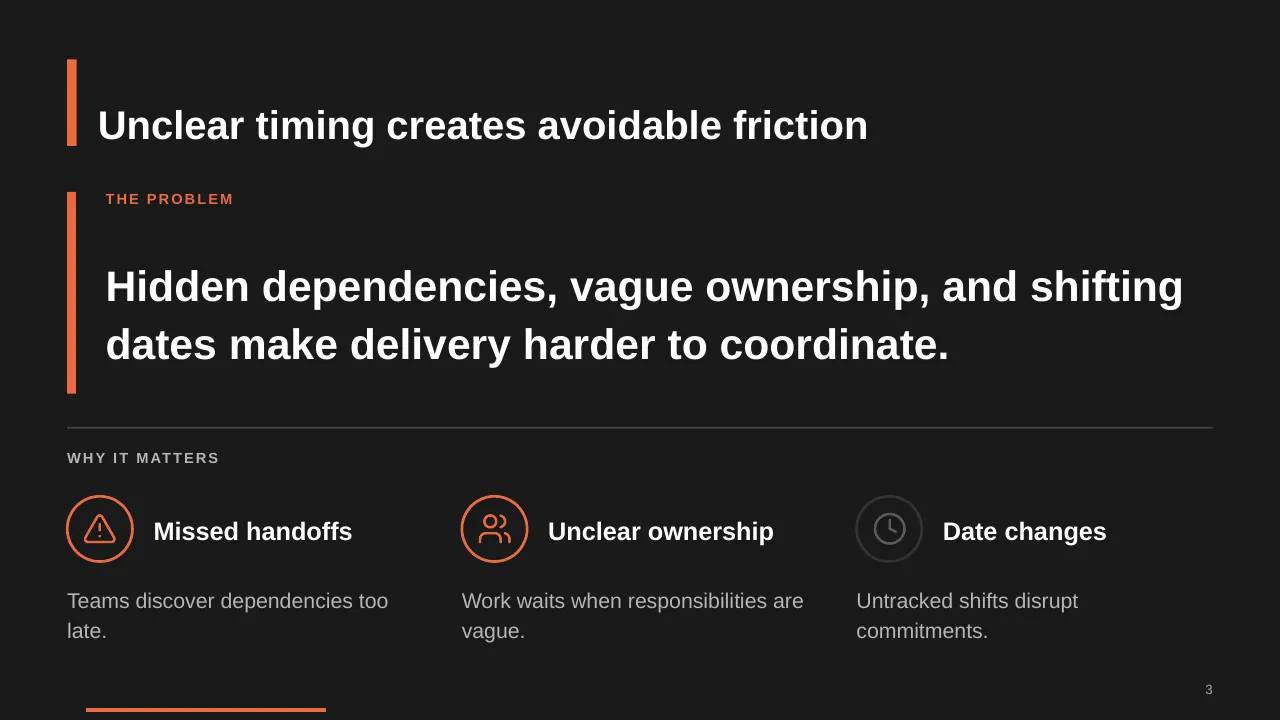
| 3 | Hidden dependencies, vague ownership, and shifting dates make delivery harder to coordinate. |
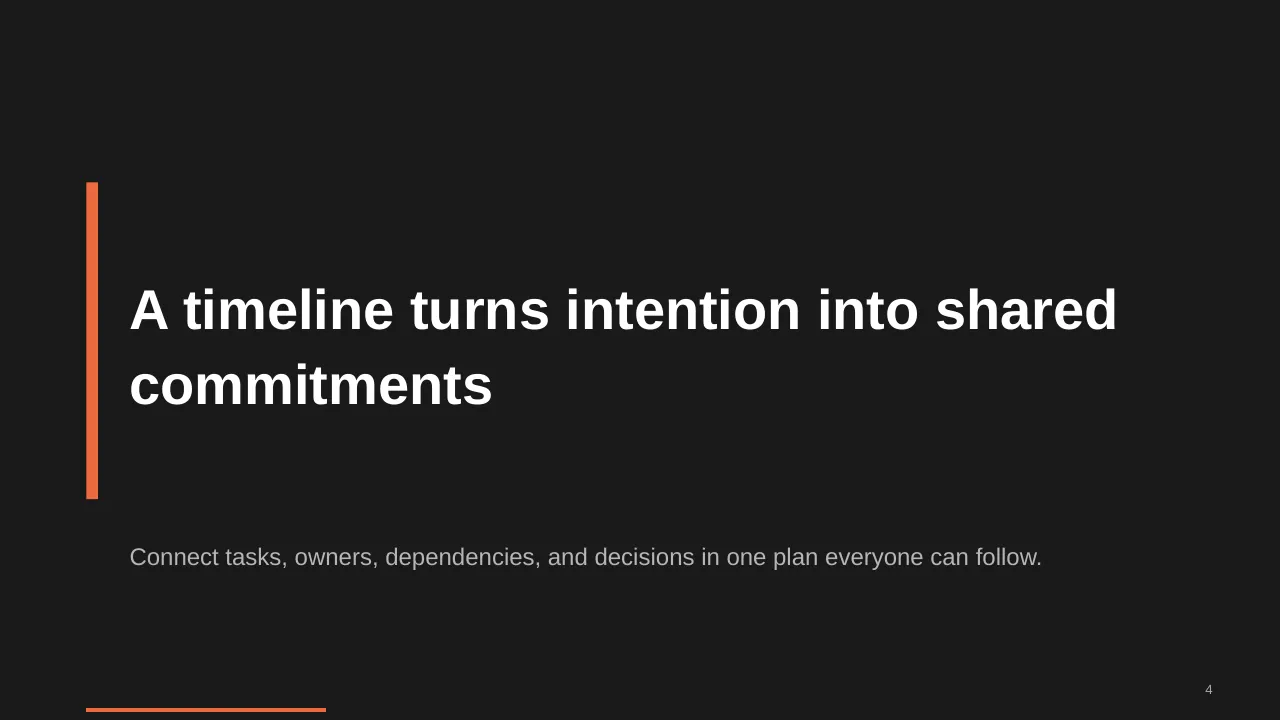
| 4 | Connect tasks, owners, dependencies, and decisions in one plan everyone can follow. |
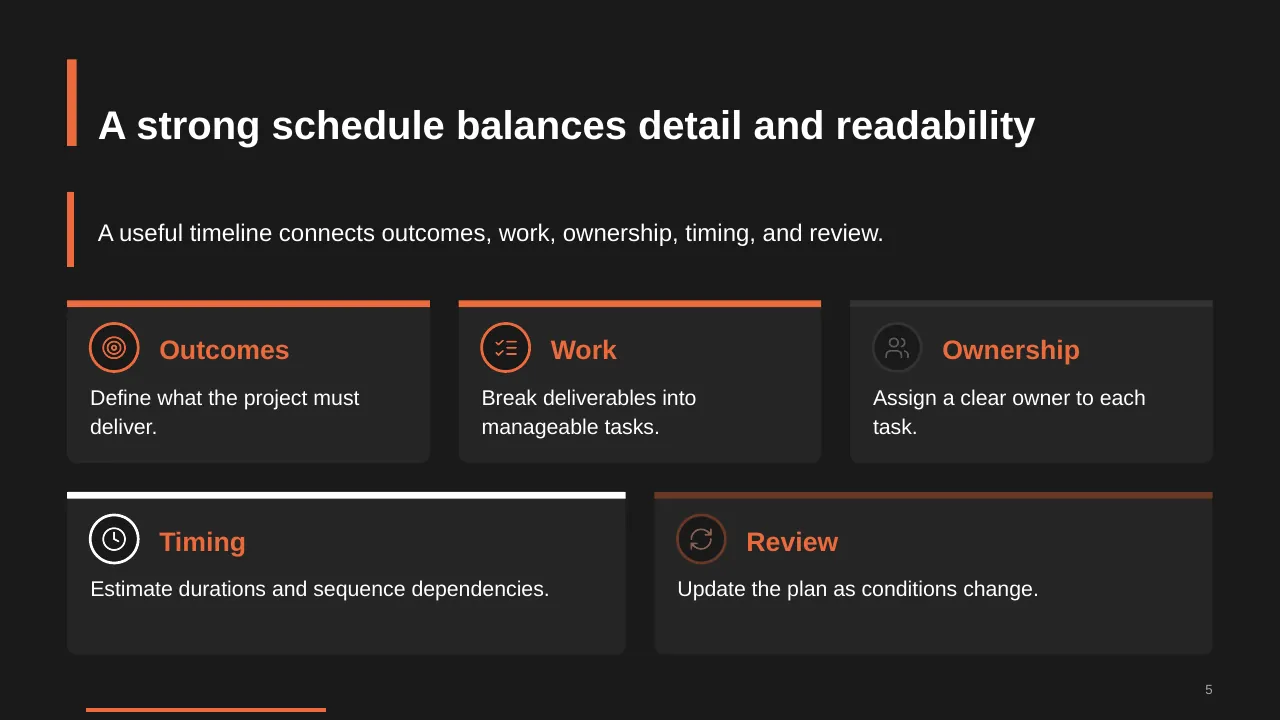
| 5 | A useful timeline connects outcomes, work, ownership, timing, and review. |
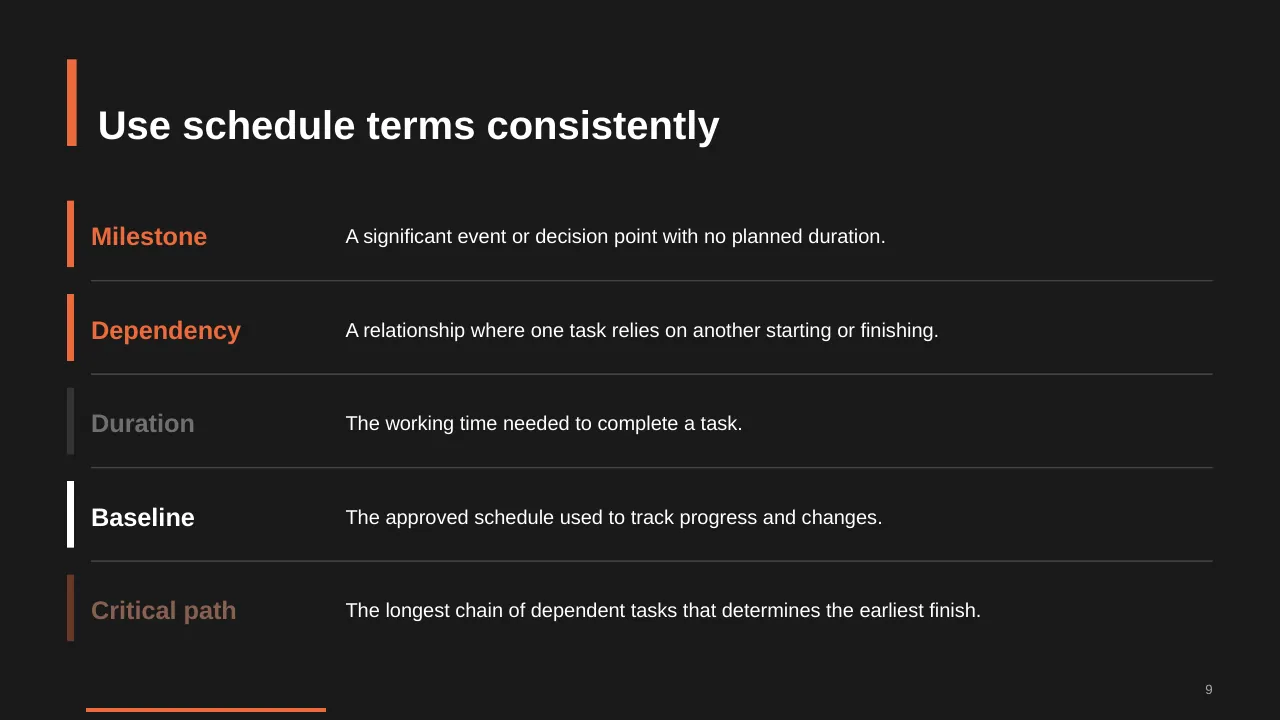
| 6 | Clarify scope, assumptions, and work before setting dates. |
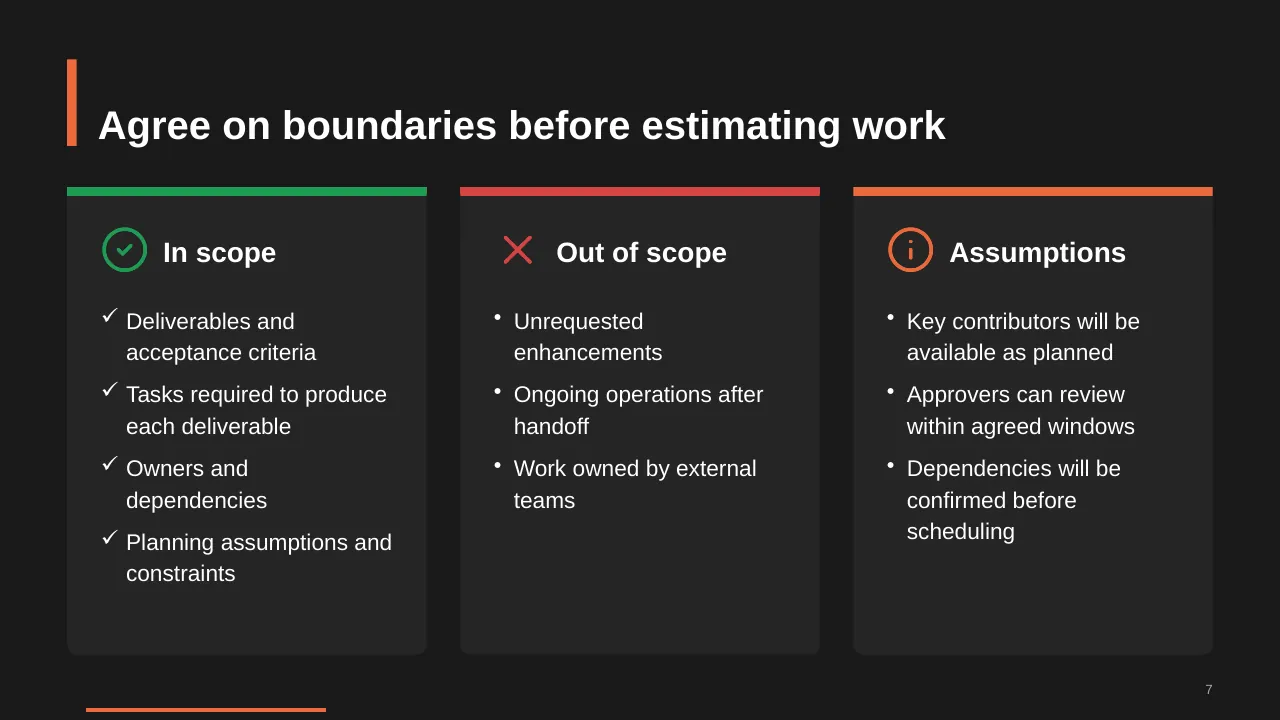
| 7 | Deliverables and acceptance criteria Tasks required to produce each deliverable Owners and dependencies… |
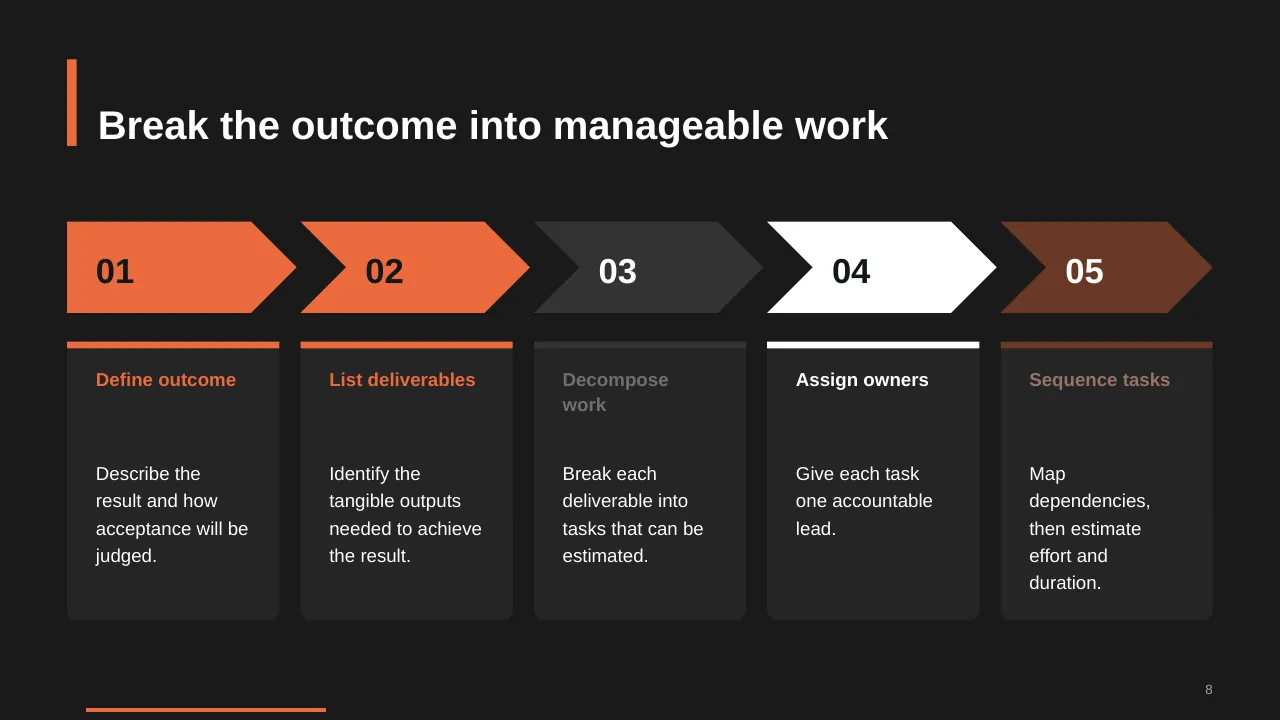
| 8 | Break the outcome into manageable work |
| 9 | A significant event or decision point with no planned duration. |
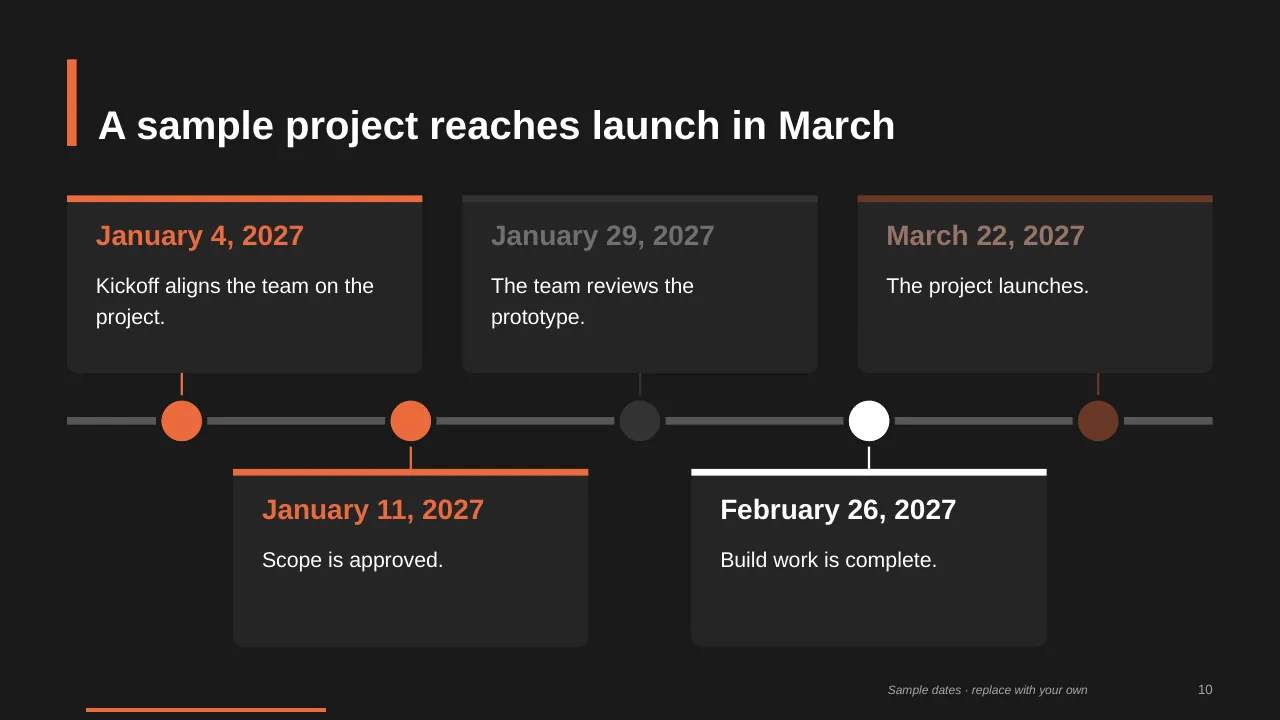
| 10 | A sample project reaches launch in March |
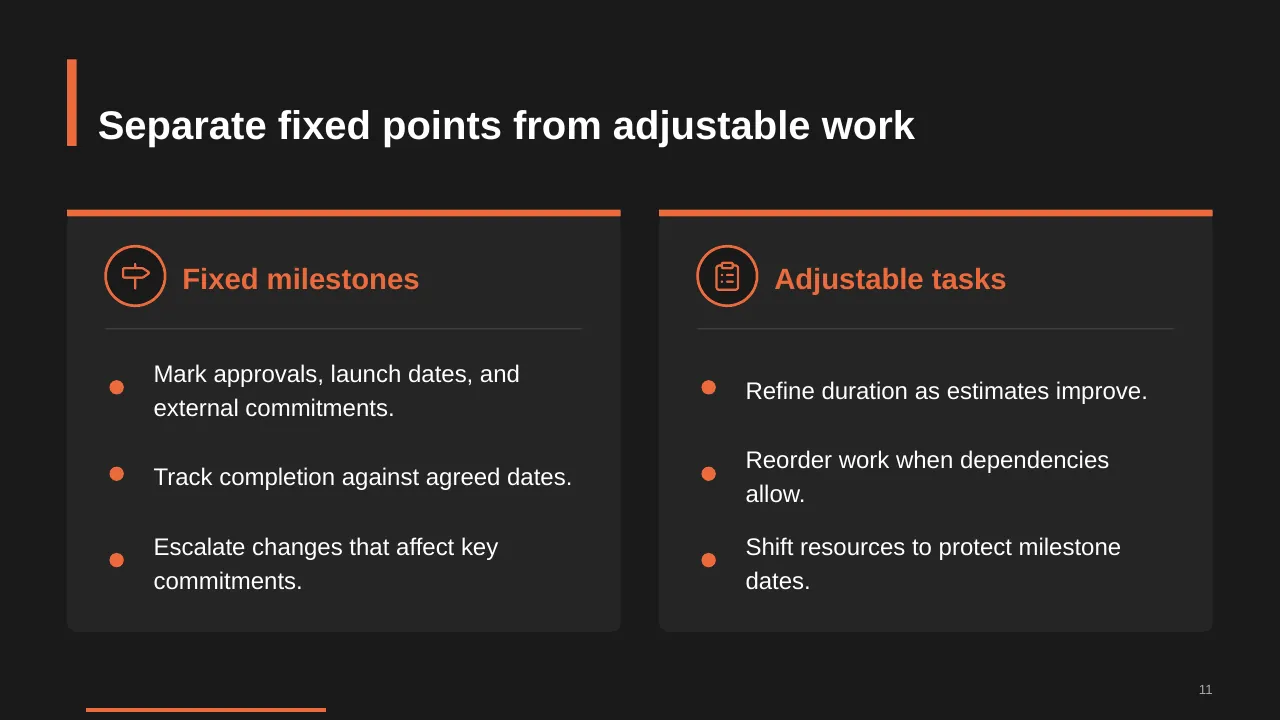
| 11 | Mark approvals, launch dates, and external commitments. |
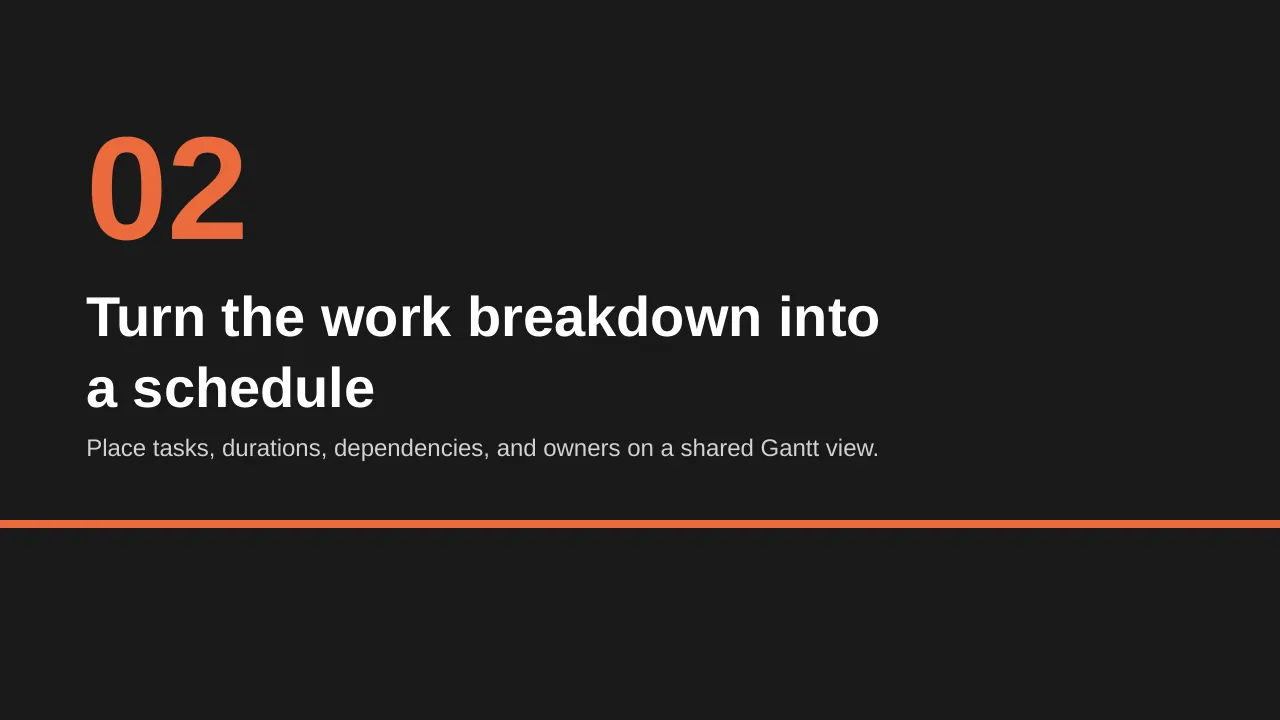
| 12 | Place tasks, durations, dependencies, and owners on a shared Gantt view. |
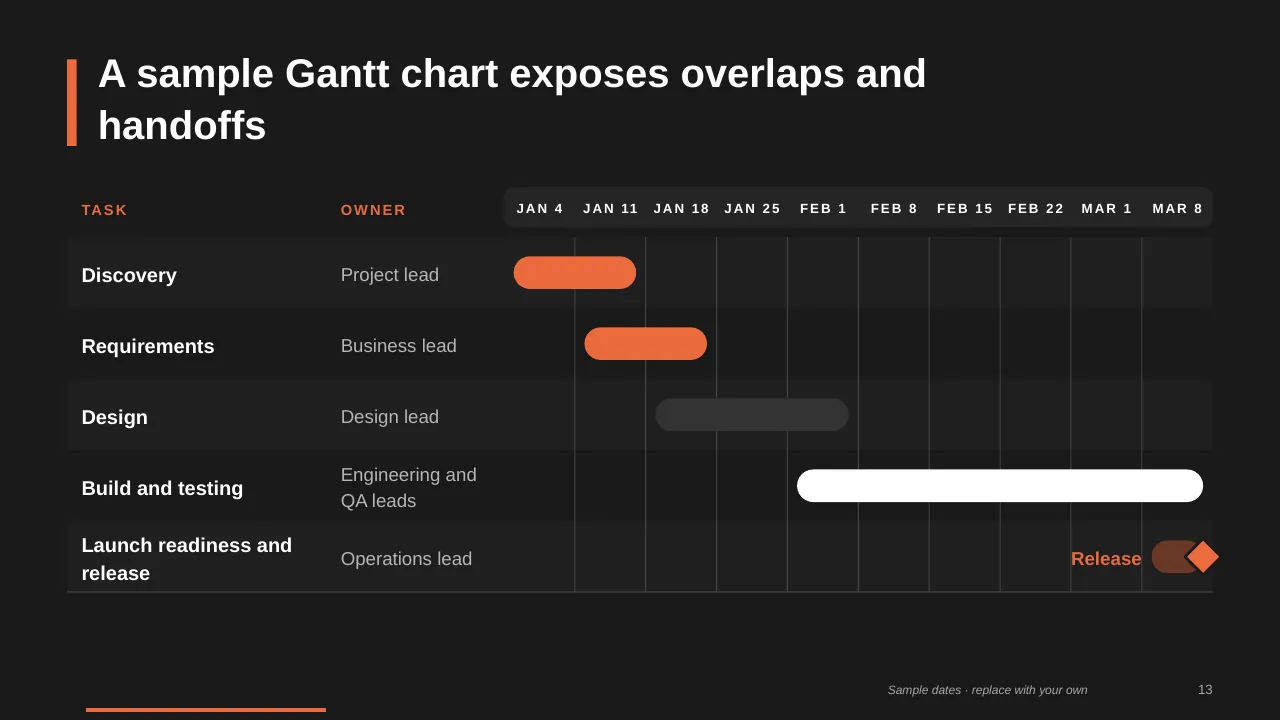
| 13 | A sample Gantt chart exposes overlaps and handoffs |
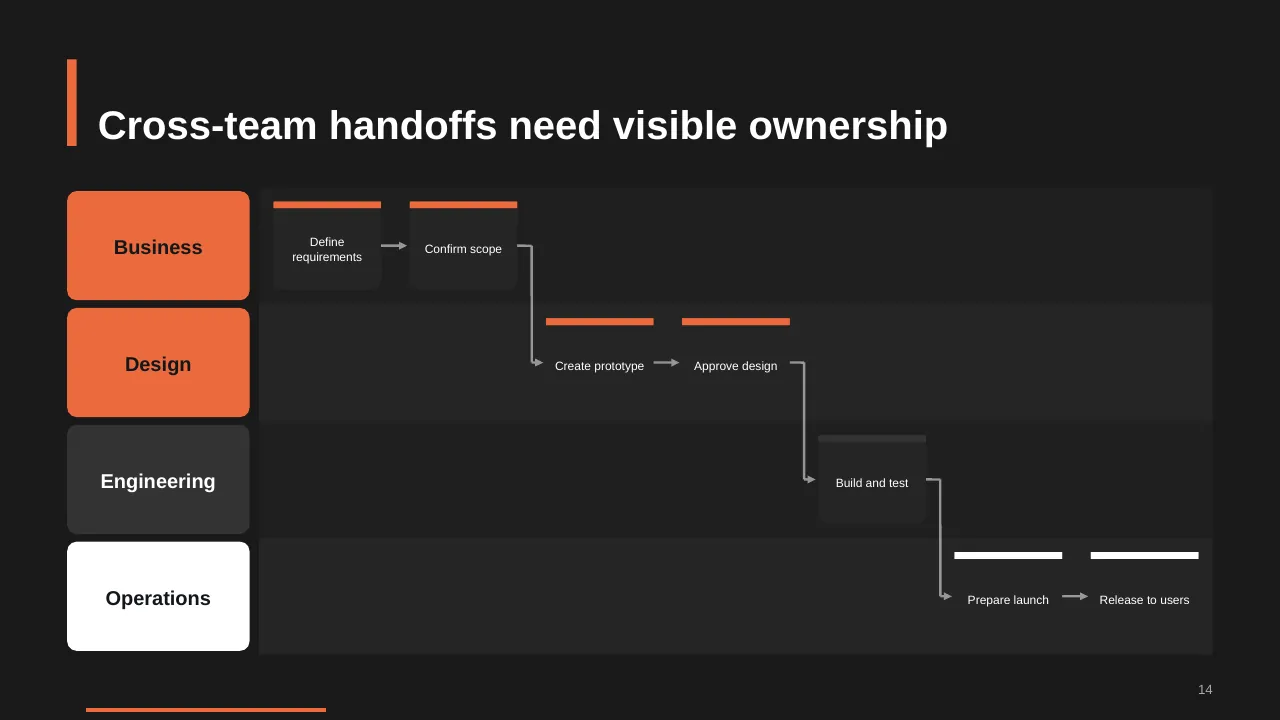
| 14 | Cross-team handoffs need visible ownership |
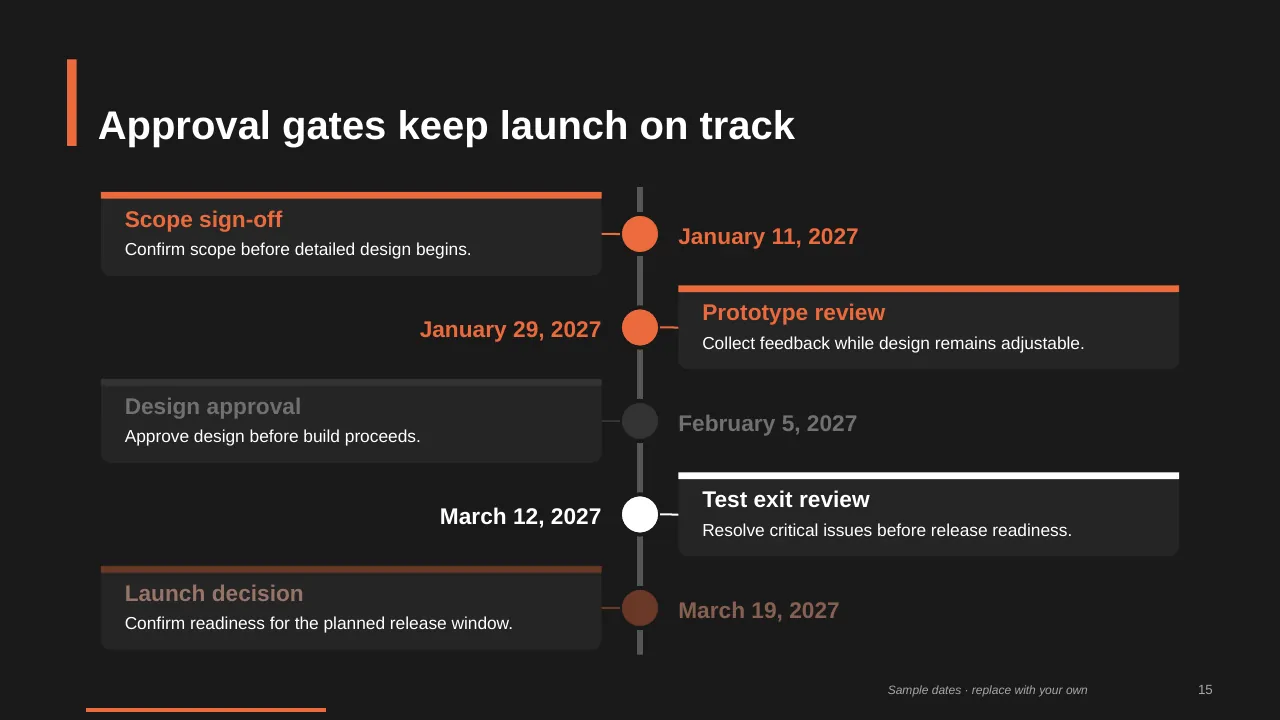
| 15 | Approval gates keep launch on track |
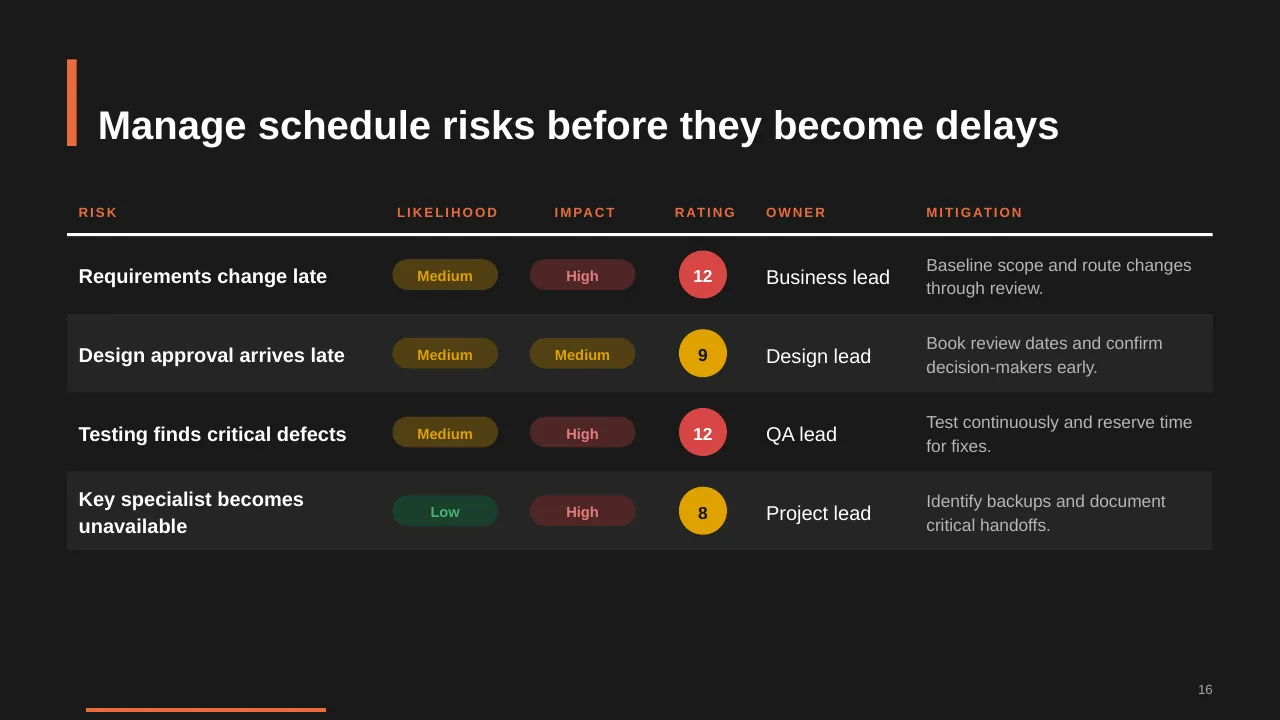
| 16 | Manage schedule risks before they become delays |
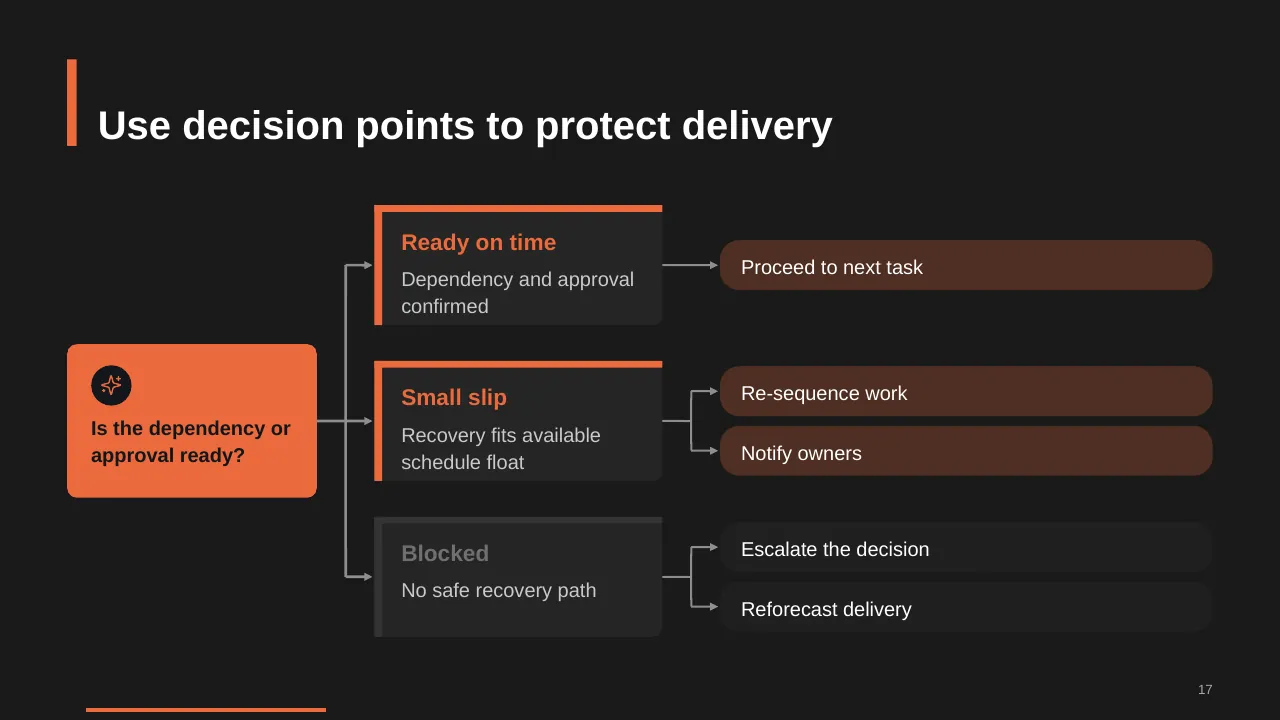
| 17 | Use decision points to protect delivery |
| 18 | Track progress, respond to change, and keep commitments visible. |
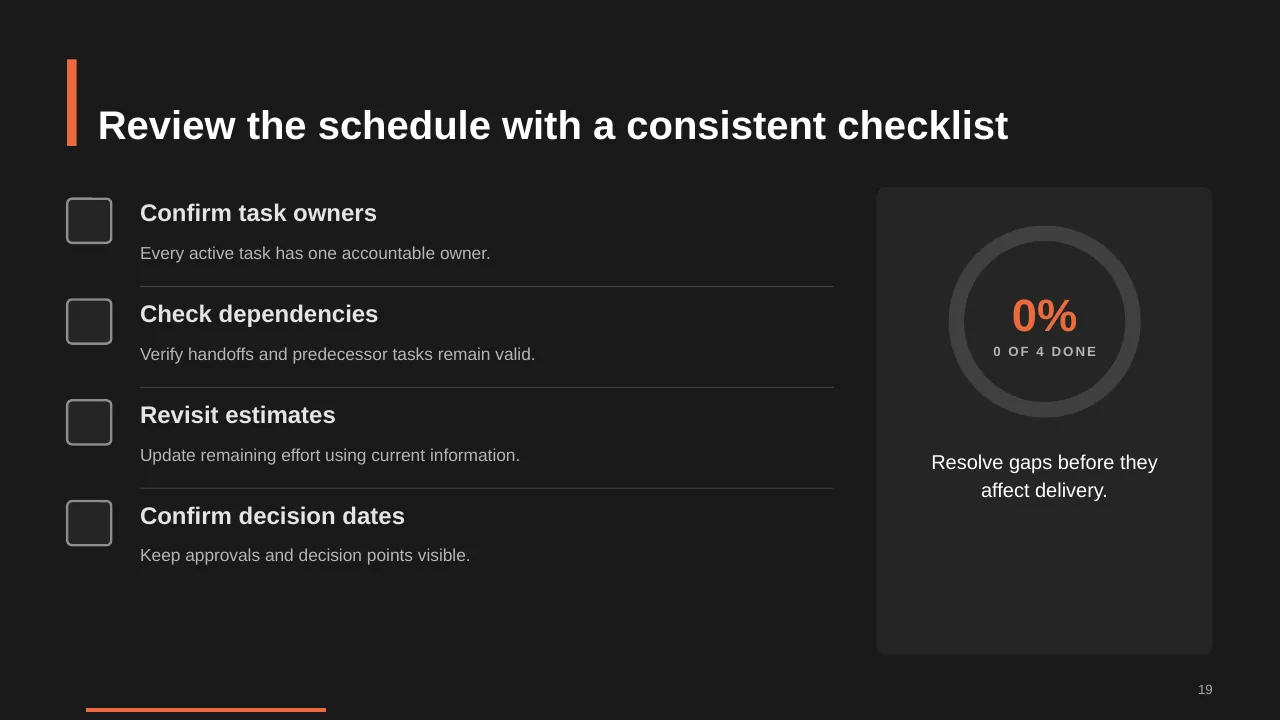
| 19 | Review the schedule with a consistent checklist |
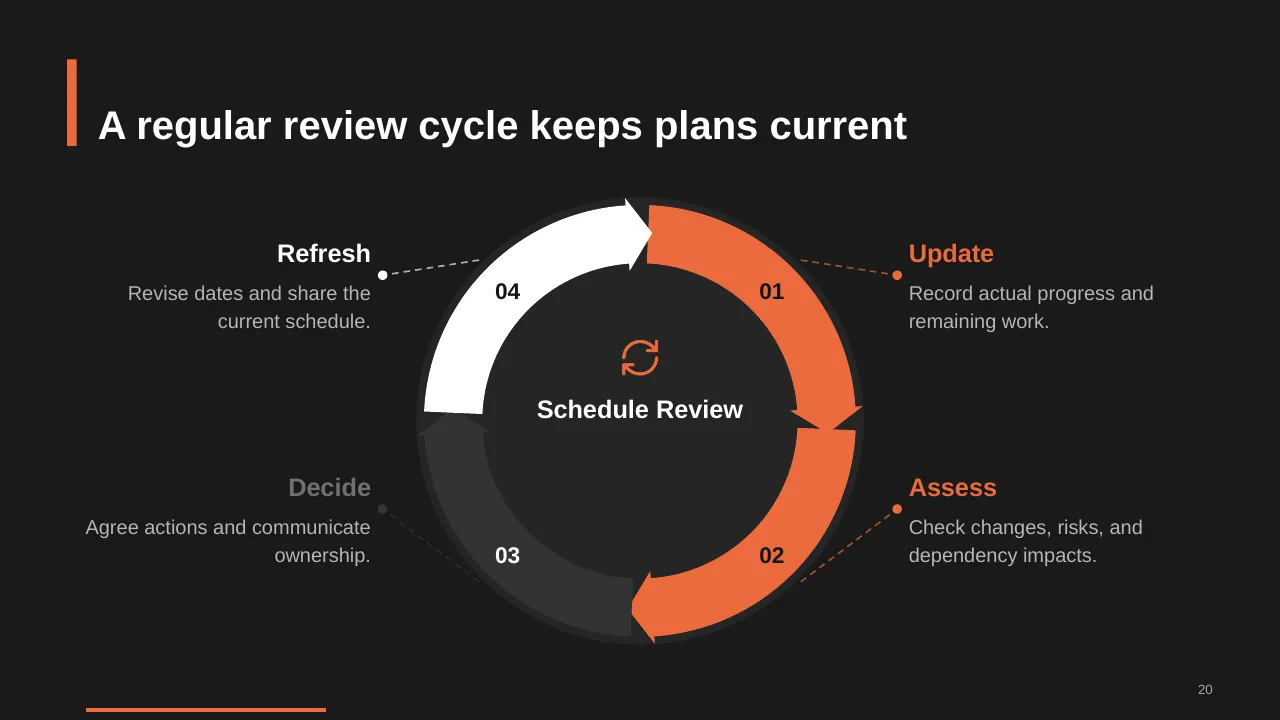
| 20 | A regular review cycle keeps plans current |
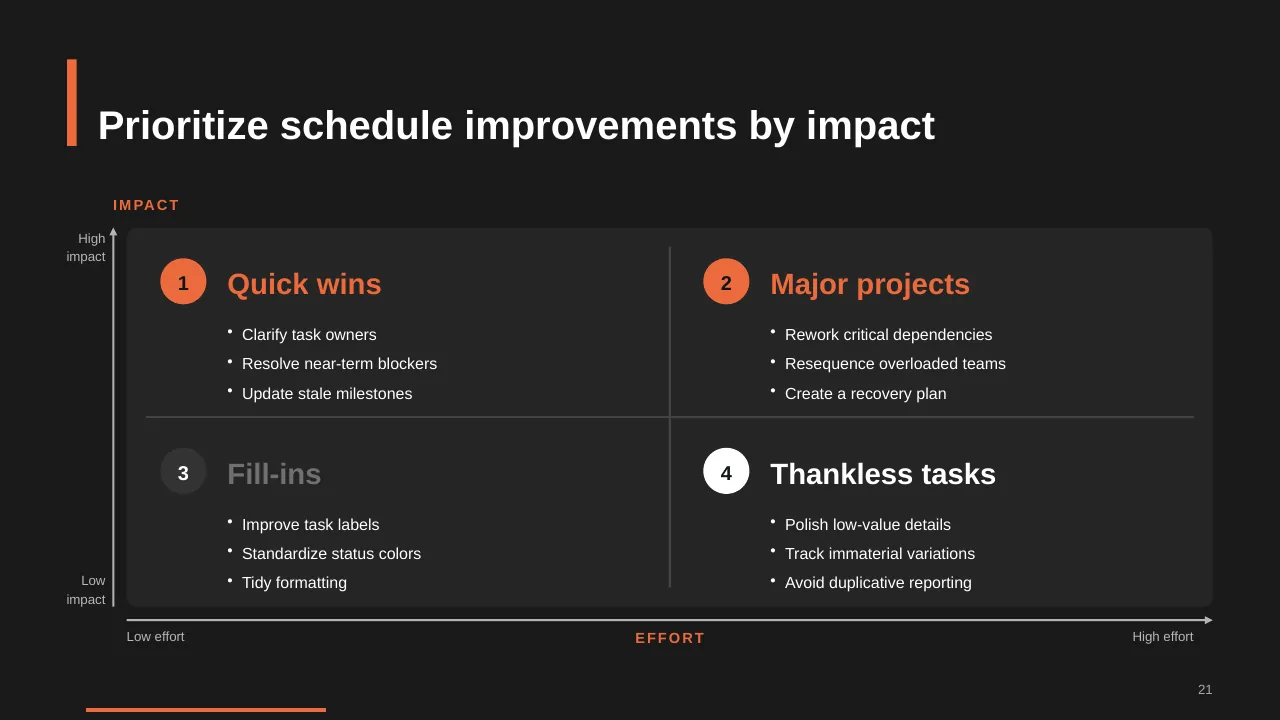
| 21 | Prioritize schedule improvements by impact |
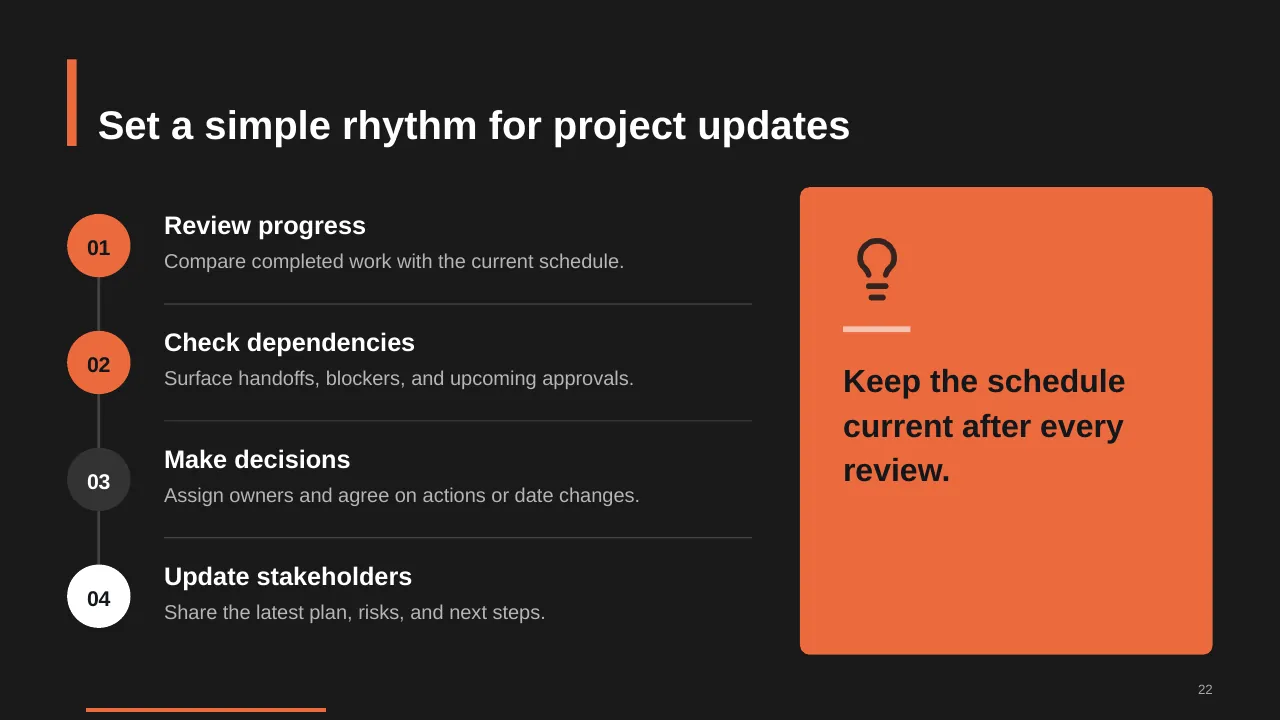
| 22 | Set a simple rhythm for project updates |
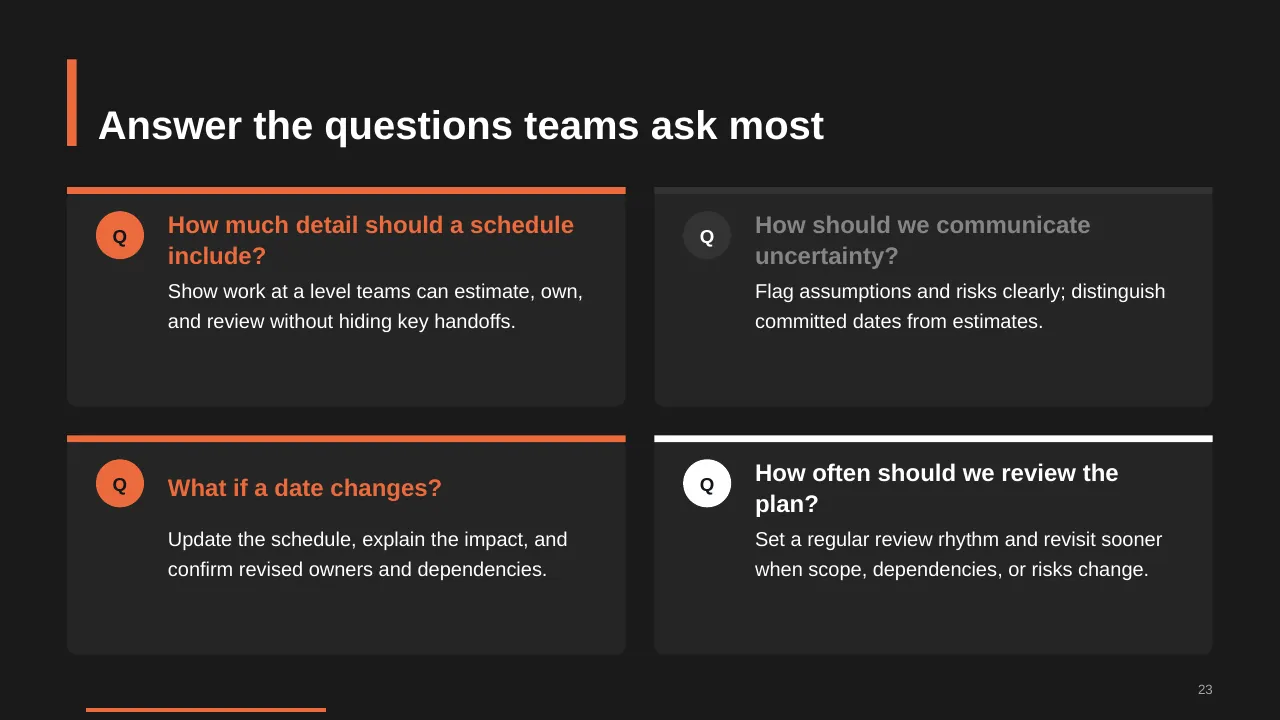
| 23 | How much detail should a schedule include? |
| 24 | A reliable schedule makes change manageable |
| 25 | Align in the next planning session, then maintain one shared schedule. |
Tips for a roadmap or timeline
- Show near-term items in detail and later items at a higher level.
- Use swimlanes for teams or themes so ownership is clear.
- Mark dependencies between items.
- Add a 'last updated' date.
Mistakes to avoid
- Too many items on one slide
- Fixed dates for uncertain work
- No owners for workstreams
Checklist before you present
- Is the overall goal clear?
- Is the timeline readable at a glance?
- Are milestones marked?
- Are dependencies shown?
- Is the update date visible?
Great for
- Product and release planning
- Strategy and transformation roadmaps
- Project schedules and Gantt charts
- Quarterly and multi-year plans
How to customise it
- Download the ZIP file and unzip it to get the .pptx presentation.
- Open it in PowerPoint, or upload it to Google Drive and open it with Google Slides.
- Replace the sample text and numbers with your own; charts update from their data sheets.
- Change the theme colours once to recolour the whole deck, then delete any slides you don't need.
Questions about a roadmap or timeline
What is the difference between a roadmap and a project plan?
A roadmap shows direction and major milestones at a high level; a project plan breaks the work into tasks, owners and dates.
How do I edit the timeline dates?
Click the text boxes on the timeline to change dates and labels, and drag shapes to move or resize bars.
Related presentations
- HR Services Implementation Roadmap PowerPoint Template
- Product Roadmap PowerPoint Template
- Business Timeline PPT Template
- Five-Year Timeline Roadmap PowerPoint Template
Browse all Roadmaps & Timelines presentations or more roadmap templates.
Template details
| Template | Project Management Timeline Gantt Chart PowerPoint Template |
|---|---|
| Categories | Roadmap, Roadmaps & Timelines |
| File format | PowerPoint (.pptx), delivered as a .zip file |
| Number of slides | 25 fully editable slides |
| File size | 2.1 MB |
| Slide size | 16:9 widescreen |
| Preview images | 25 |
| Editable | Yes: text, colours, shapes, icons and charts |
| Works with | PowerPoint 2010 and later, PowerPoint for Mac, Google Slides |
| Licence | Royalty-free, yours to keep using after your plan ends (terms of use apply) |
| Price | Included in every SlideVilla plan |
| Added | 31 Jan 2025 |
Questions about this template
Can I edit the Project Management Timeline Gantt Chart PowerPoint Template?
Yes. Every part of the Project Management Timeline Gantt Chart PowerPoint Template is made with native PowerPoint shapes and text boxes, so you can change the wording, colours, fonts and sizes, move or delete elements, and swap icons without losing quality.
Does the Project Management Timeline Gantt Chart PowerPoint Template work in Google Slides?
Yes. Download the .zip file, unzip it to get the .pptx, upload it to Google Drive and open it with Google Slides. The layout, shapes and text stay editable there too.
Is the Project Management Timeline Gantt Chart PowerPoint Template free?
It is a premium template, included in every SlideVilla plan together with the rest of the library. See plans and pricing.
What size and format is it?
It is a PPTX file in 16:9 widescreen format with 25 slides, 2.1 MB (downloaded as a .zip; unzip it to get the presentation), with 25 preview images shown above.
How to use this template
- Step 1DownloadClick Download, then unzip the .zip file to get the .pptx presentation.
- Step 2OpenOpen it in PowerPoint, or upload it to Google Slides from your Drive.
- Step 3Make it yoursChange text, colours, icons and charts. Every element is fully editable.
Categories
Related PowerPoint templates
More designs like this one, ready to edit.


