About this PowerPoint template
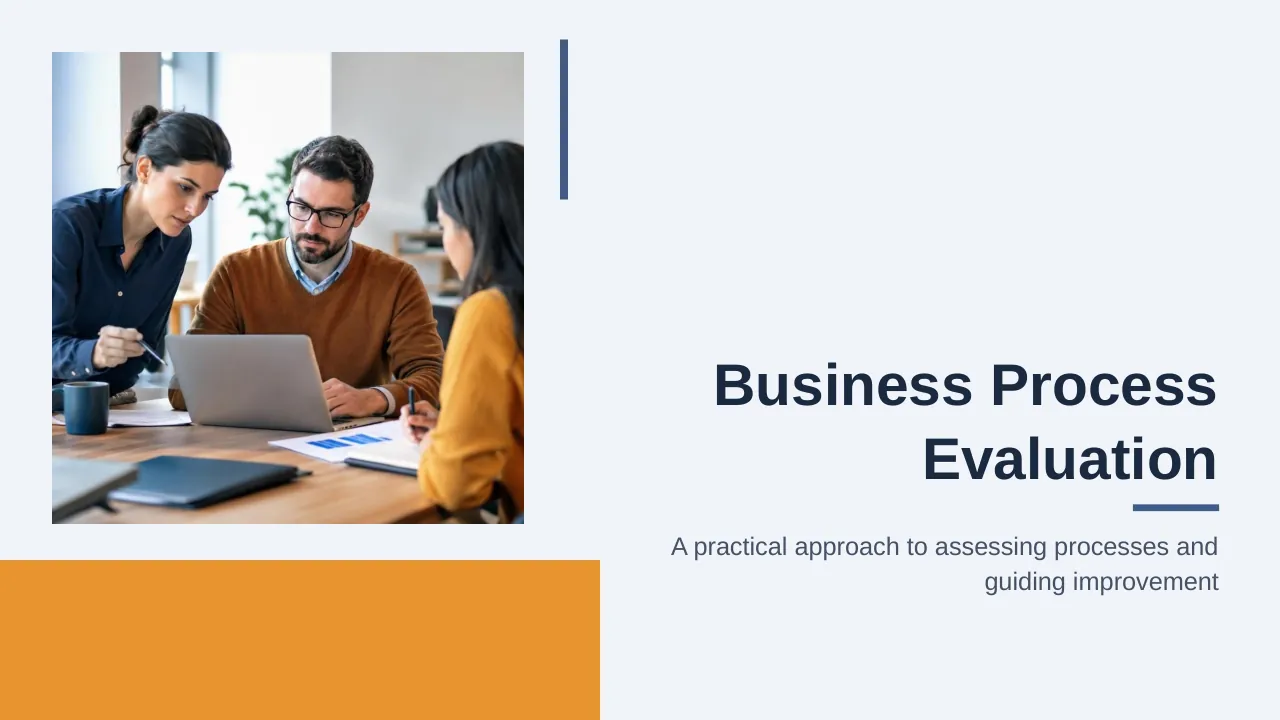
The Process Evaluation Matrix PPT Template is a complete 30-slide presentation: a practical guide to understanding implementation and improving delivery. Every slide is fully editable in PowerPoint and Google Slides, so you can change the text, colours, charts and icons to fit your brand in minutes.
Inside, the slides walk through topics such as “Good evaluation connects delivery with decisions”, “Treat evaluation as a learning loop” and “Keep recommendations focused on usable action”, with ready-made layouts for each step. It is part of our Operations & Supply Chain presentations.
On this page
What's included
- 30 professionally designed 16:9 widescreen slides
- 100% editable text, shapes, icons, tables and charts (no flat images)
- Works in Microsoft PowerPoint (Windows and Mac) and Google Slides
- Clean, consistent layout that follows your theme colours and fonts
- Delivered as a single ZIP file containing the .pptx presentation
What to include in an operations presentation
A simple structure that works for most audiences, mapped to the slides in this deck:
| Part | What goes there | Slide in this deck |
|---|---|---|
| Current performance | Key operational KPIs and issues | Use any content slide |
| Process view | How work flows today | Slides 5, 25, 30 |
| Improvement areas | Where waste, delays or quality issues sit | Slides 2, 3, 5 |
| Initiatives | Lean, automation or quality projects | Slides 11, 12, 21 |
| Measures and governance | Targets, owners and review | Use any content slide |
Key numbers: Strategy execution
Research figures you can quote on your slides. Each one names the study it comes from, so your audience can check it.
| Finding | Figure | Source |
|---|---|---|
| Firms that struggle to bridge strategy and day-to-day implementation | 61% | Economist Intelligence Unit for PMI (2013) |
| Strategic initiatives that did not succeed over three years | 44% | Economist Intelligence Unit for PMI (2013) |
| Strategic initiatives that succeed when projects are highly aligned to strategy vs poorly | 65% vs 35% | PMI Pulse of the Profession (2014) |
| Leaders naming leadership buy-in as the top reason initiatives succeed | 51% | Economist Intelligence Unit for PMI (2013) |
Sources: PMI and EIU, Why Good Strategies Fail (press release) · PMI, Bridging the chasm. Figures are from the editions named; check for a newer edition before you present.
Slide-by-slide outline
| Slide | What it covers |
|---|---|
| 1 | Title slide: Process Evaluation Matrix |
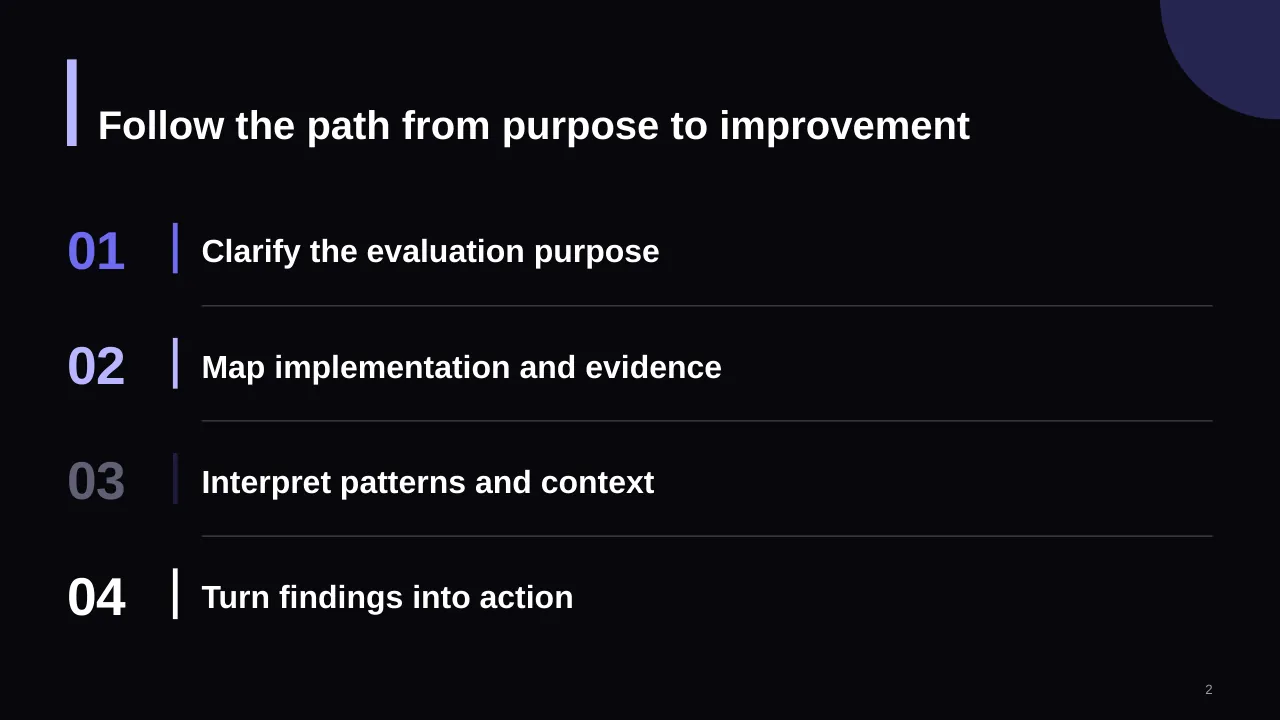
| 2 | Follow the path from purpose to improvement |
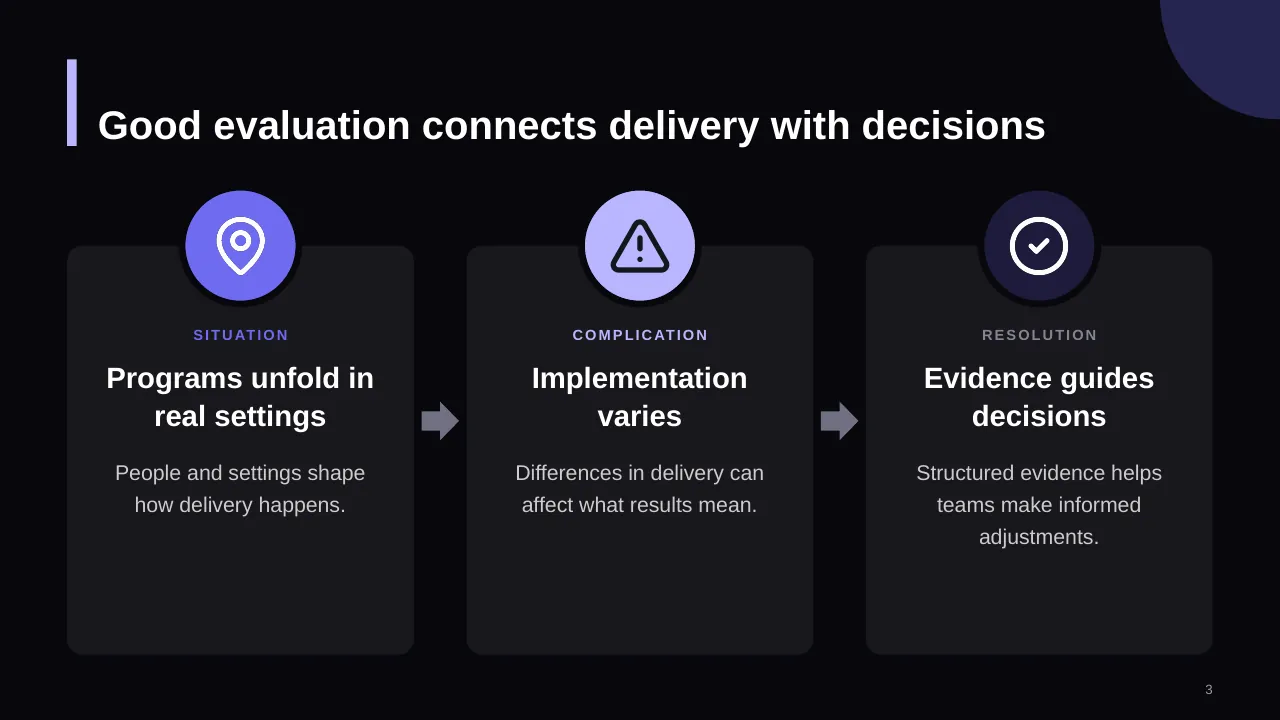
| 3 | Good evaluation connects delivery with decisions |
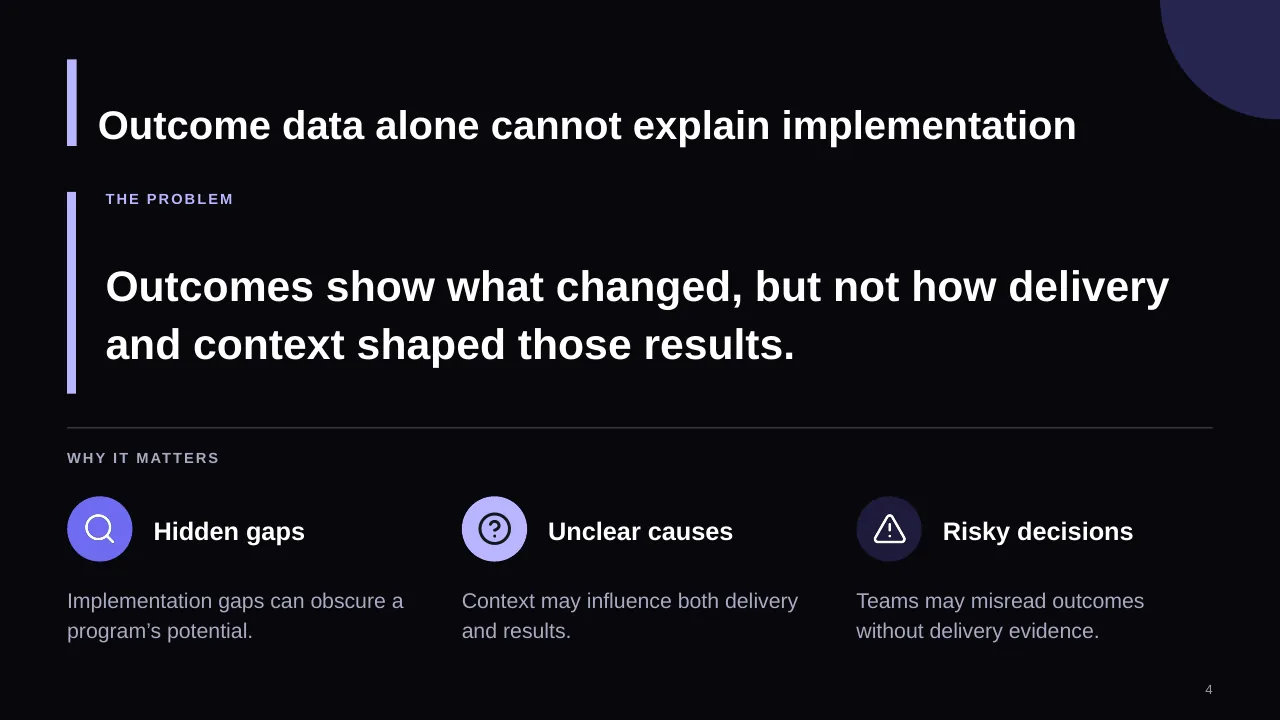
| 4 | Outcomes show what changed, but not how delivery and context shaped those results. |
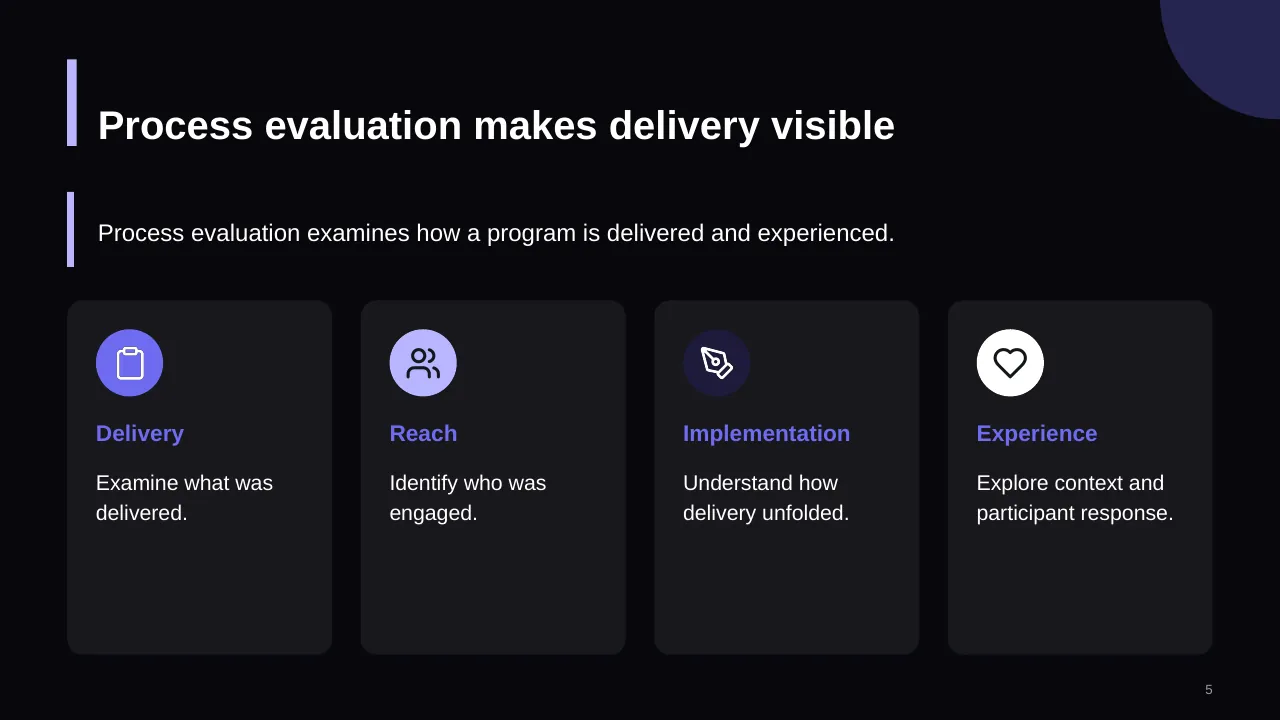
| 5 | Process evaluation examines how a program is delivered and experienced. |
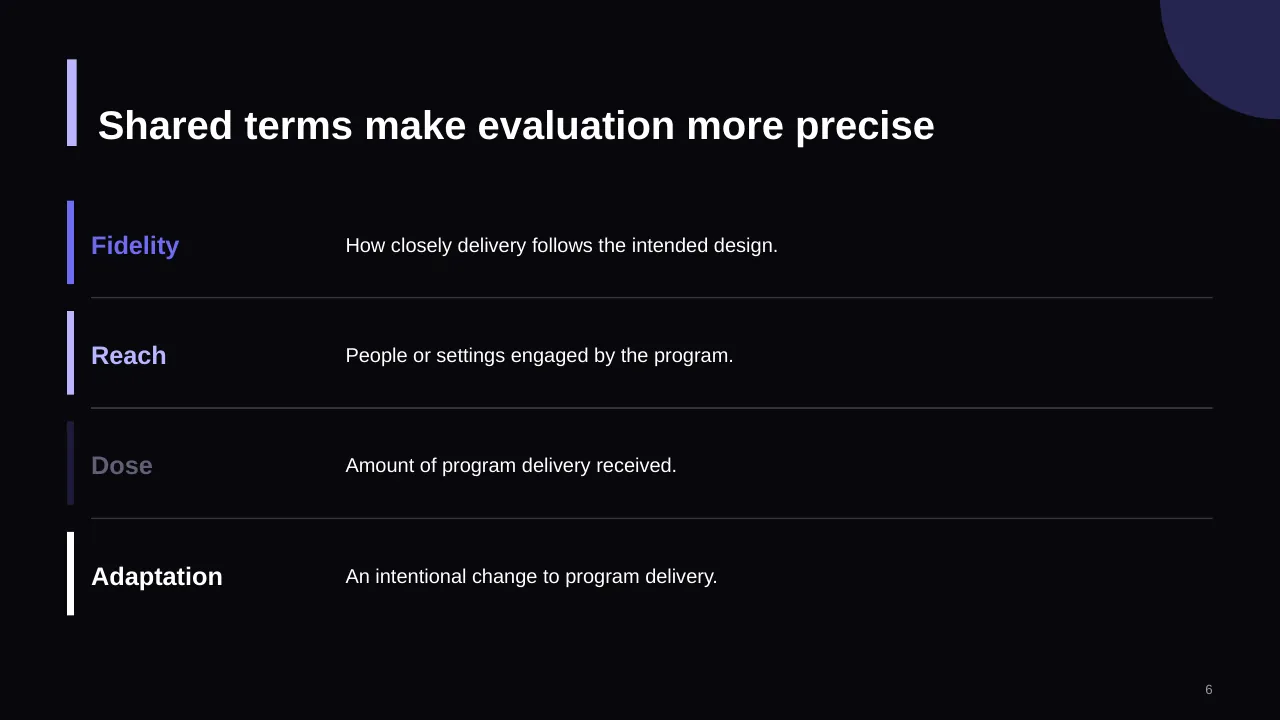
| 6 | How closely delivery follows the intended design. |
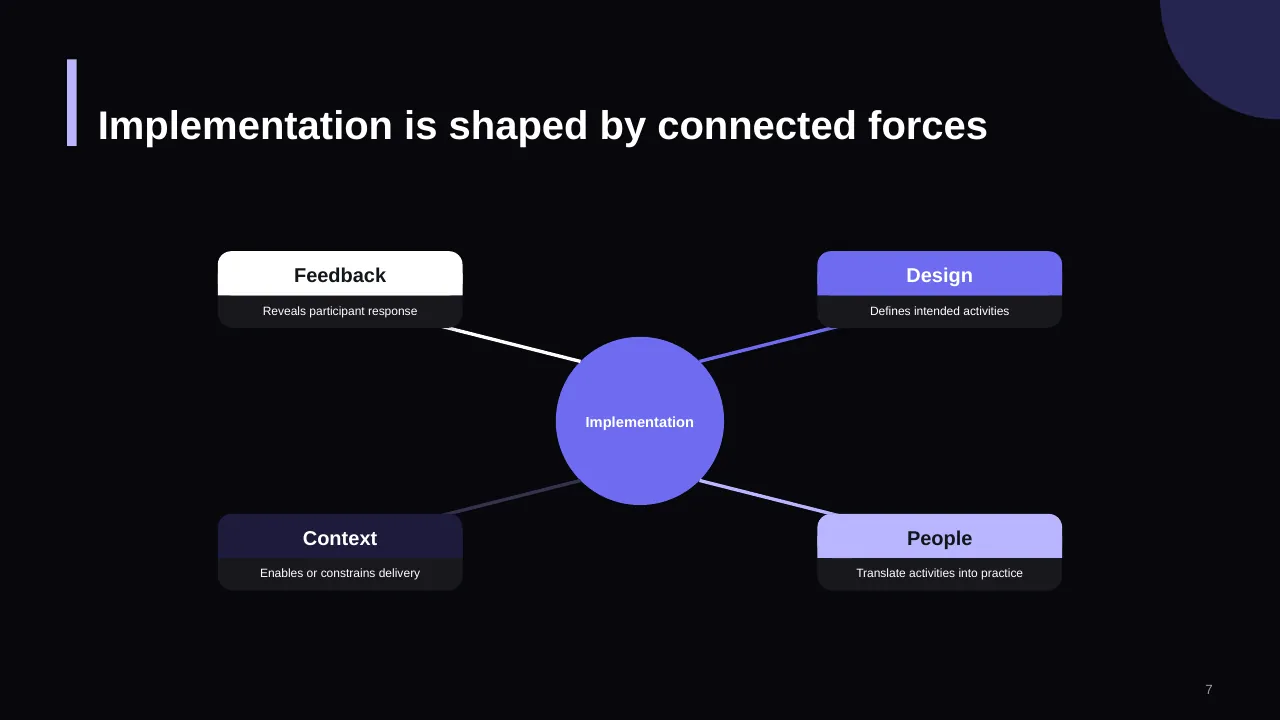
| 7 | Implementation is shaped by connected forces |
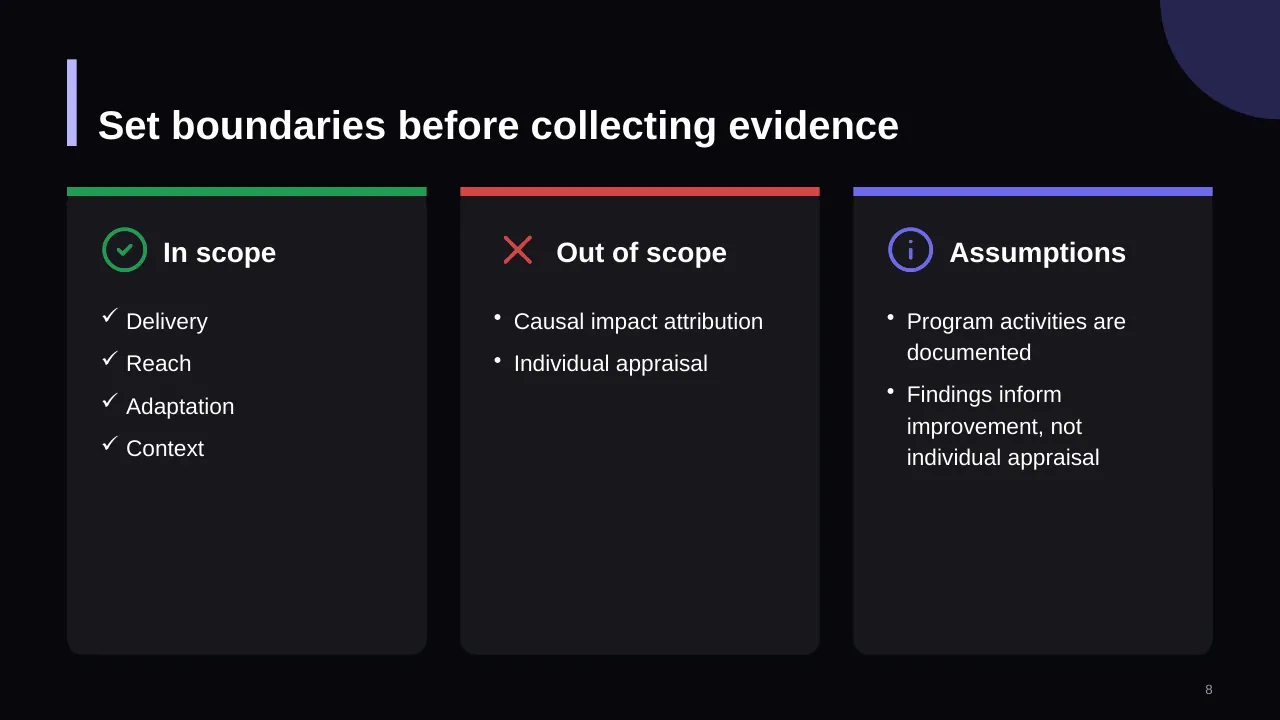
| 8 | Set boundaries before collecting evidence |
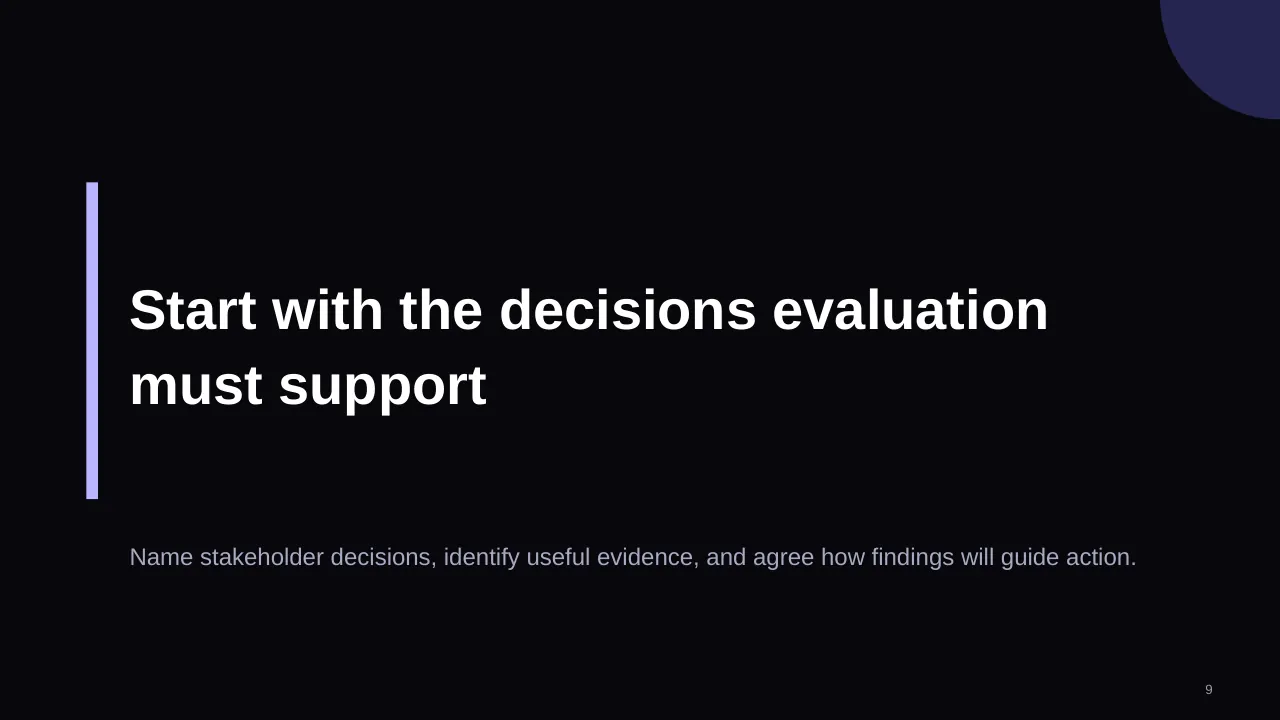
| 9 | Name stakeholder decisions, identify useful evidence, and agree how findings will guide action. |
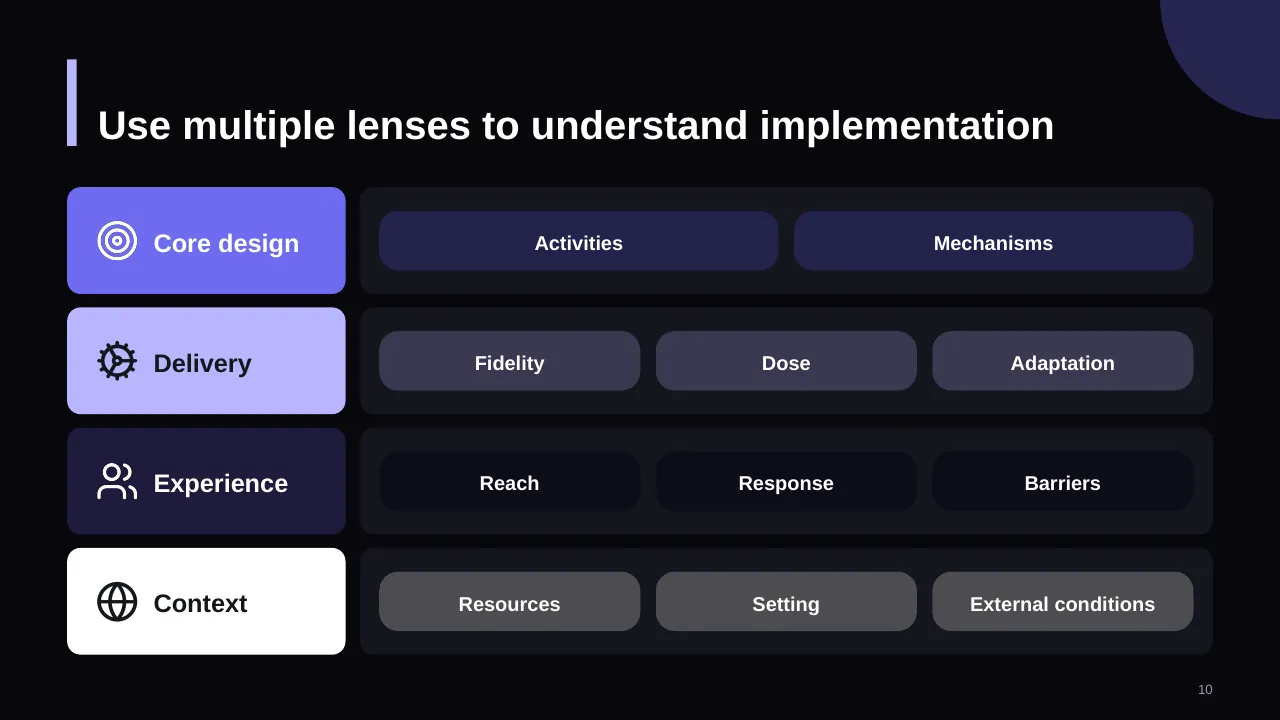
| 10 | Use multiple lenses to understand implementation |
| 11 | Specify questions first, match each to suitable evidence, and plan interpretation alongside collection. |
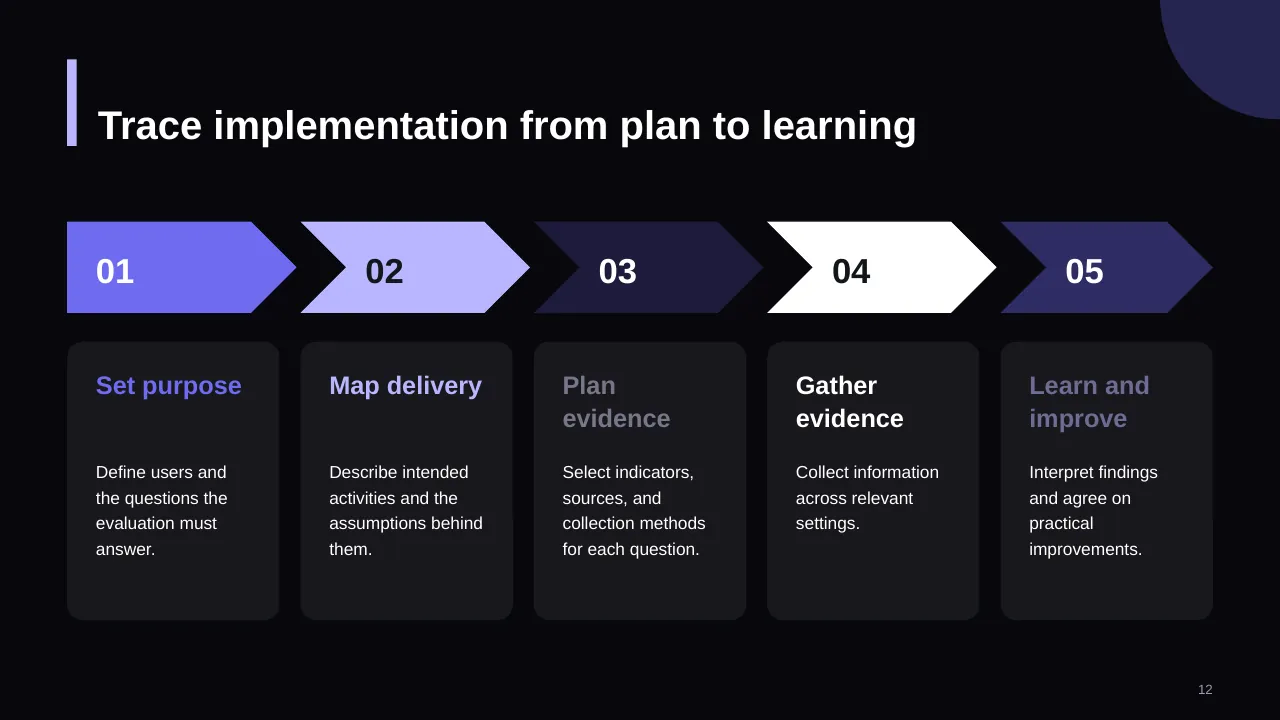
| 12 | Trace implementation from plan to learning |
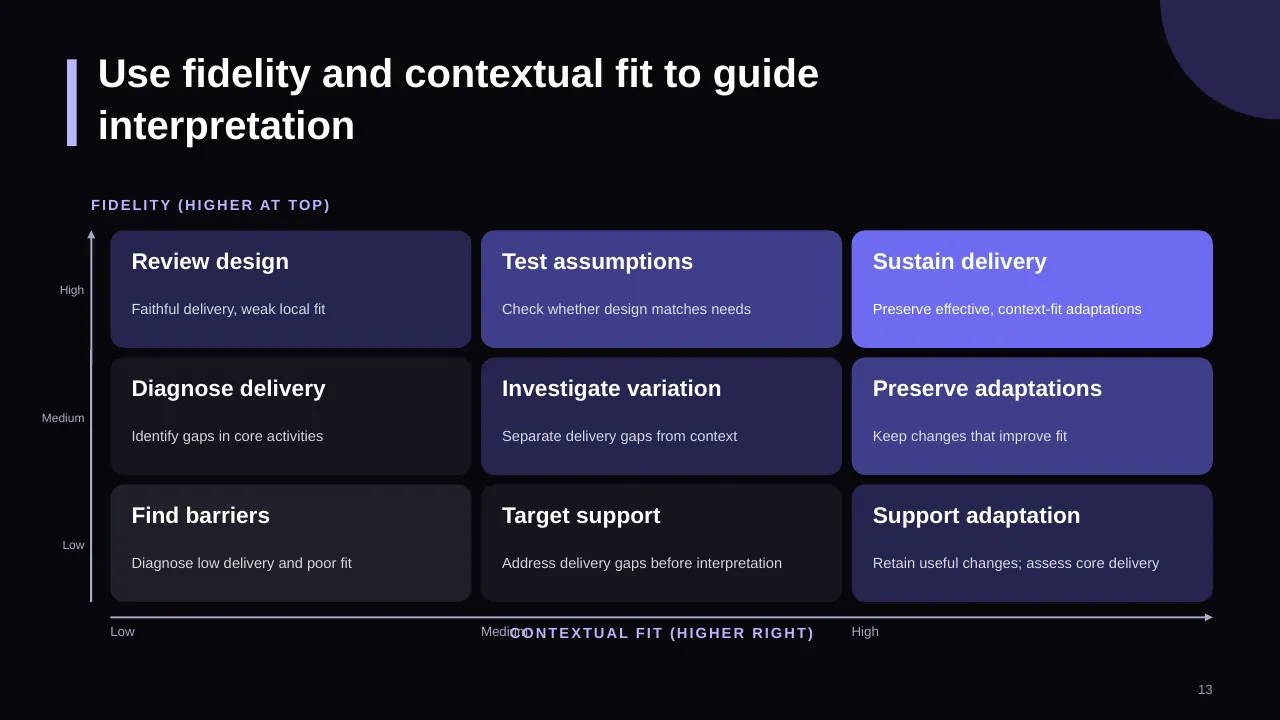
| 13 | Use fidelity and contextual fit to guide interpretation |
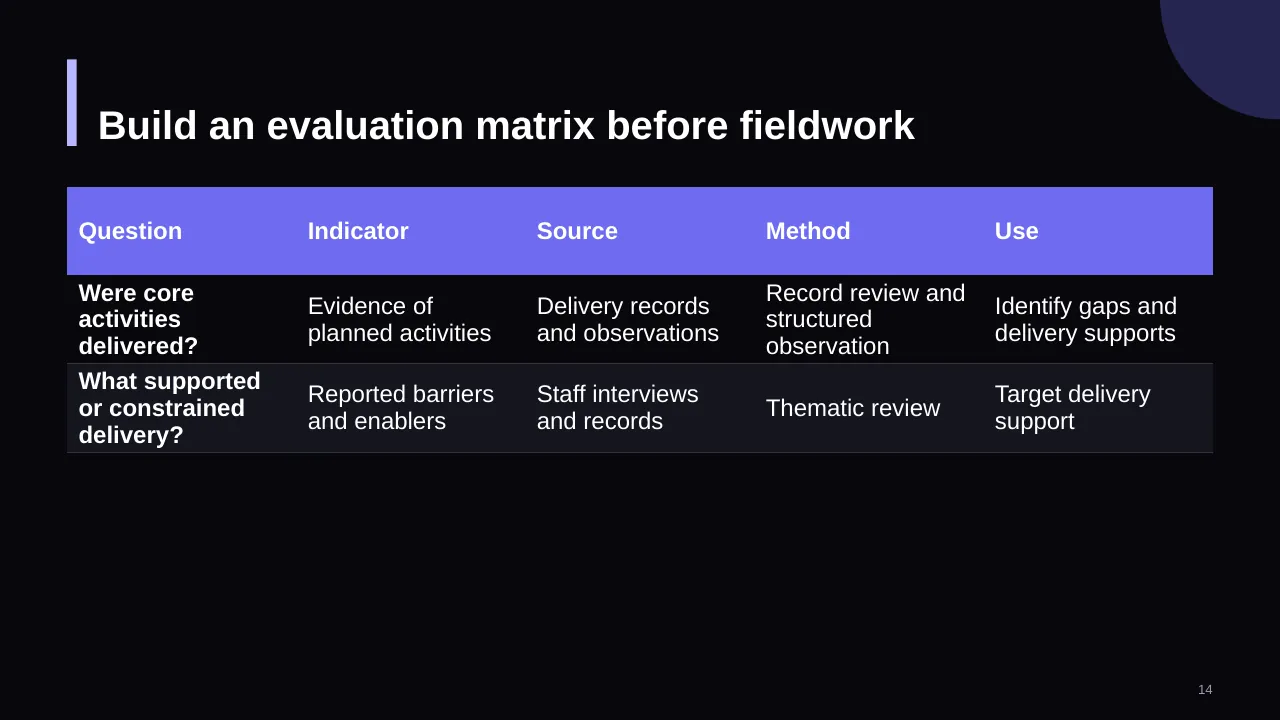
| 14 | Build an evaluation matrix before fieldwork |
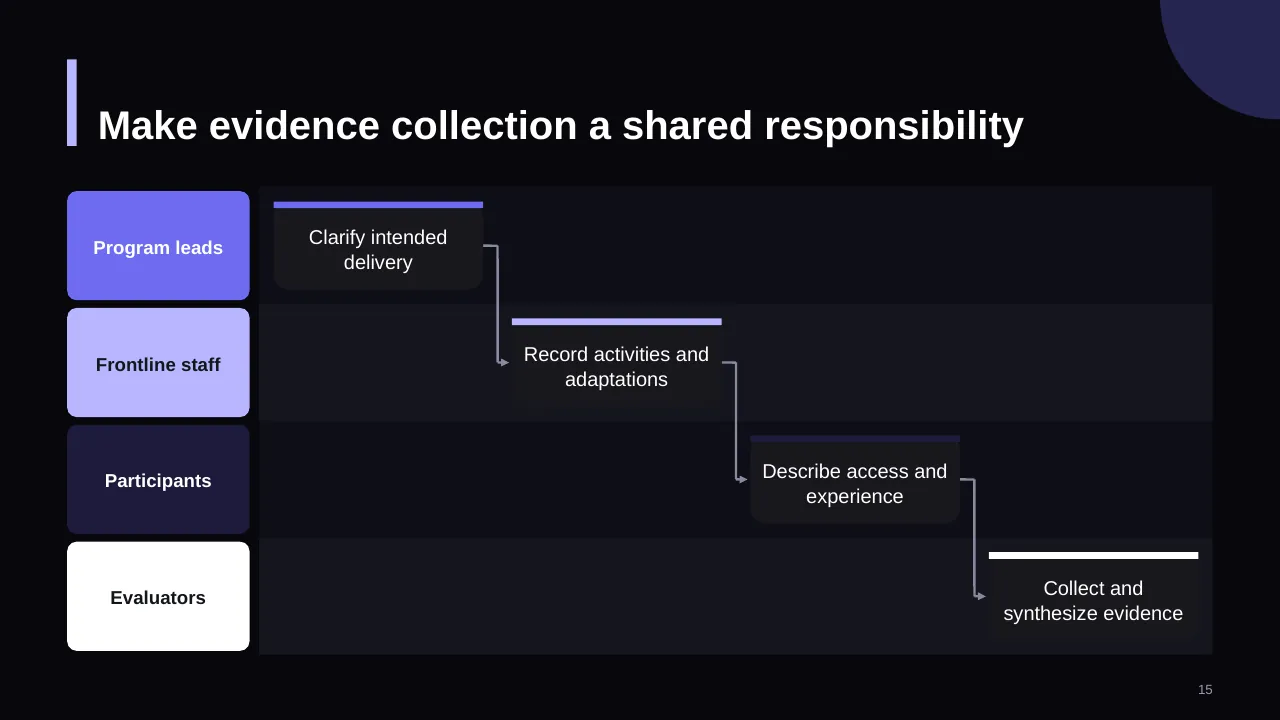
| 15 | Make evidence collection a shared responsibility |
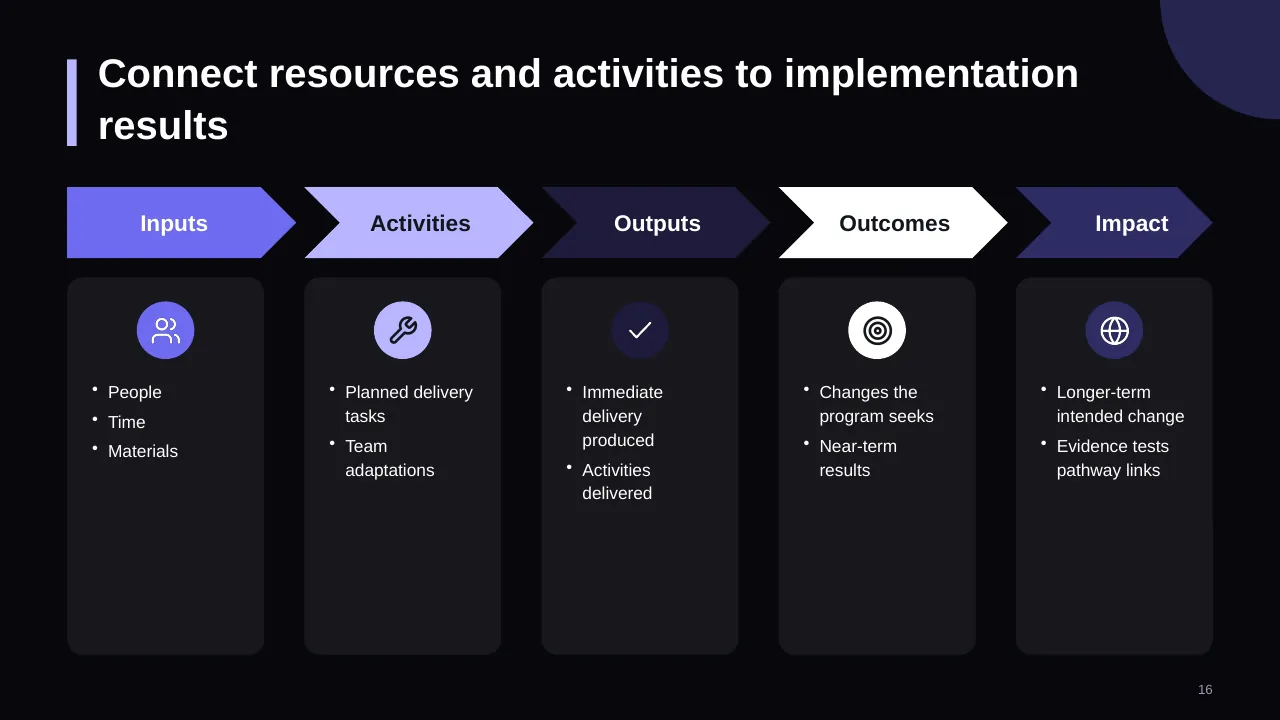
| 16 | Connect resources and activities to implementation results |
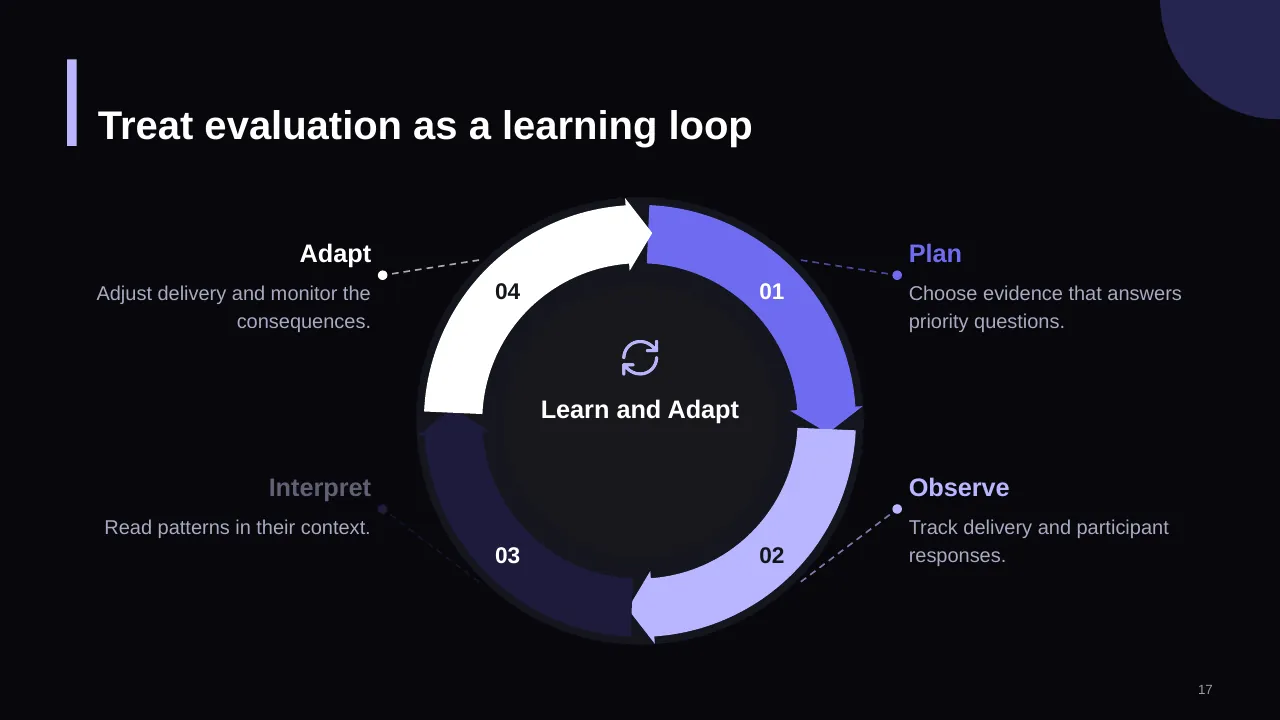
| 17 | Treat evaluation as a learning loop |
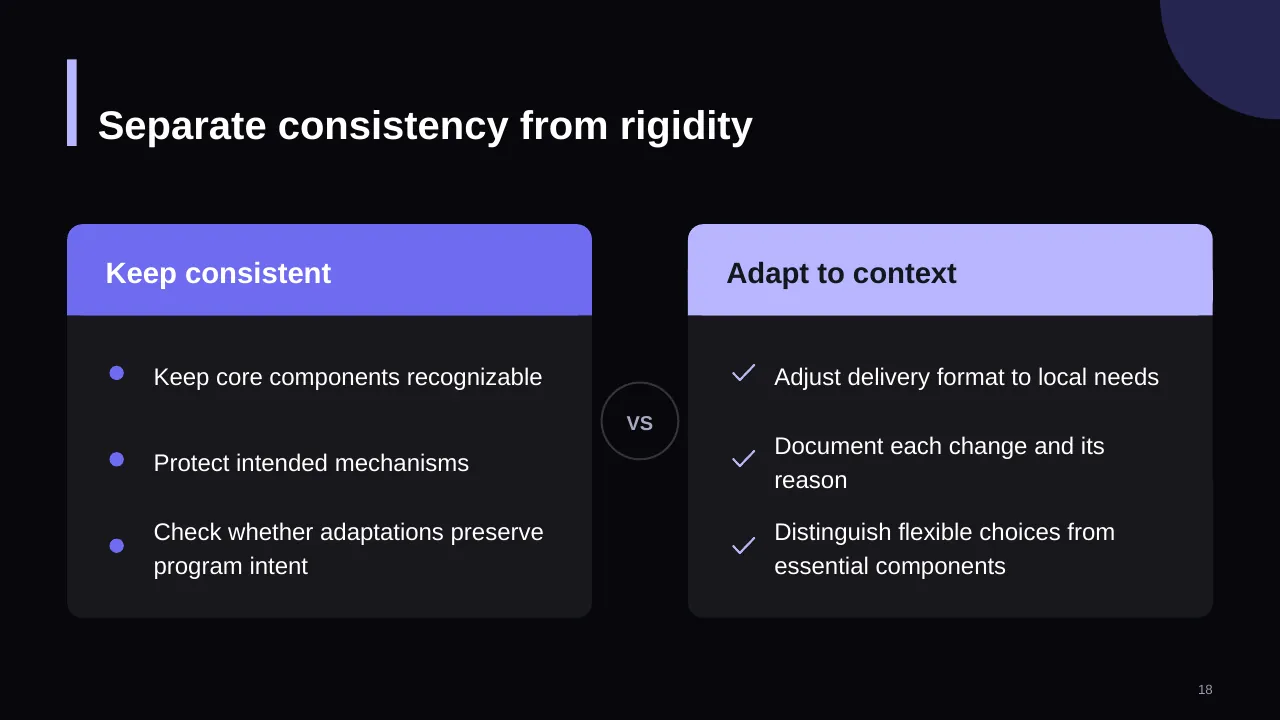
| 18 | Separate consistency from rigidity |
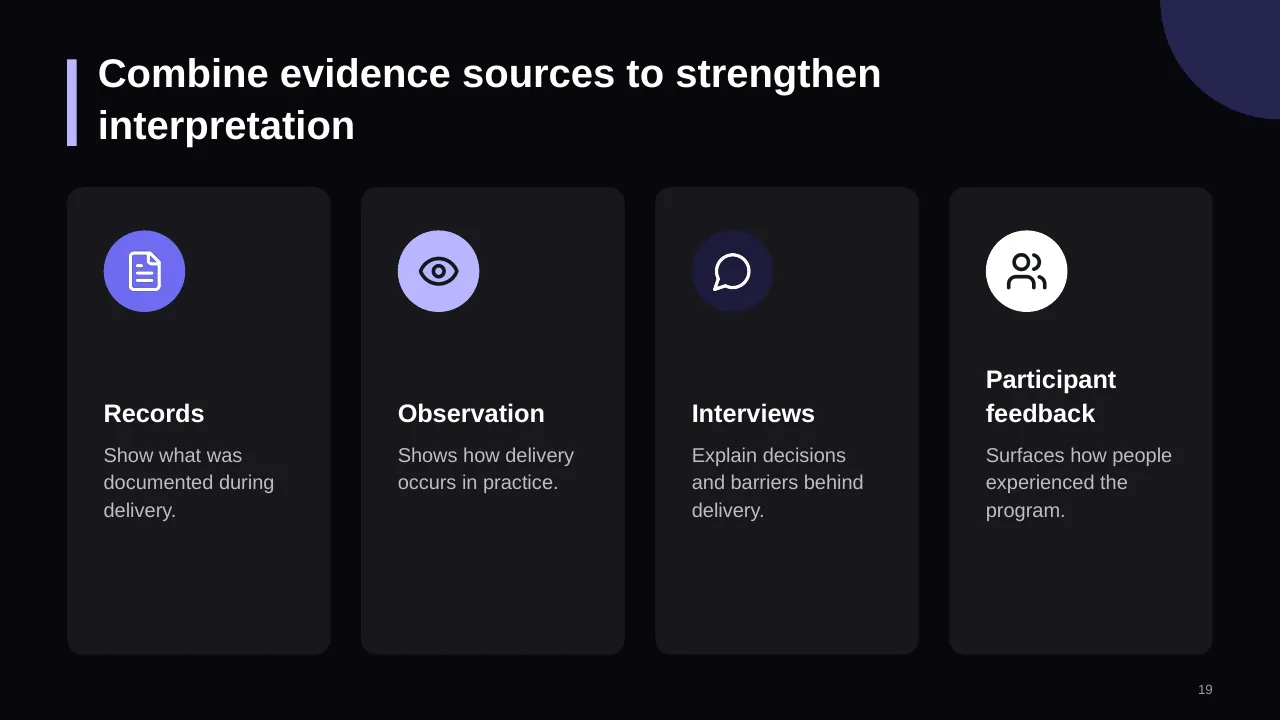
| 19 | Combine evidence sources to strengthen interpretation |
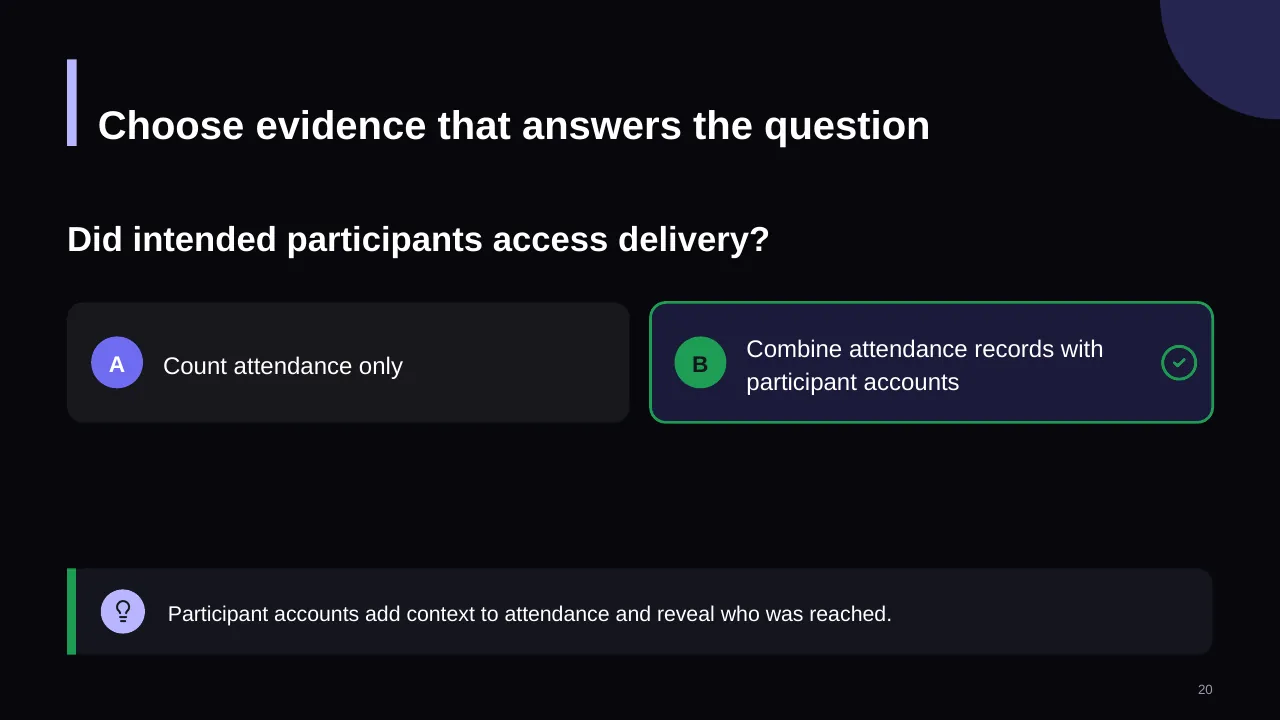
| 20 | Did intended participants access delivery? |
| 21 | Synthesize patterns, compare delivery with the plan, and consider context before explaining differences. |
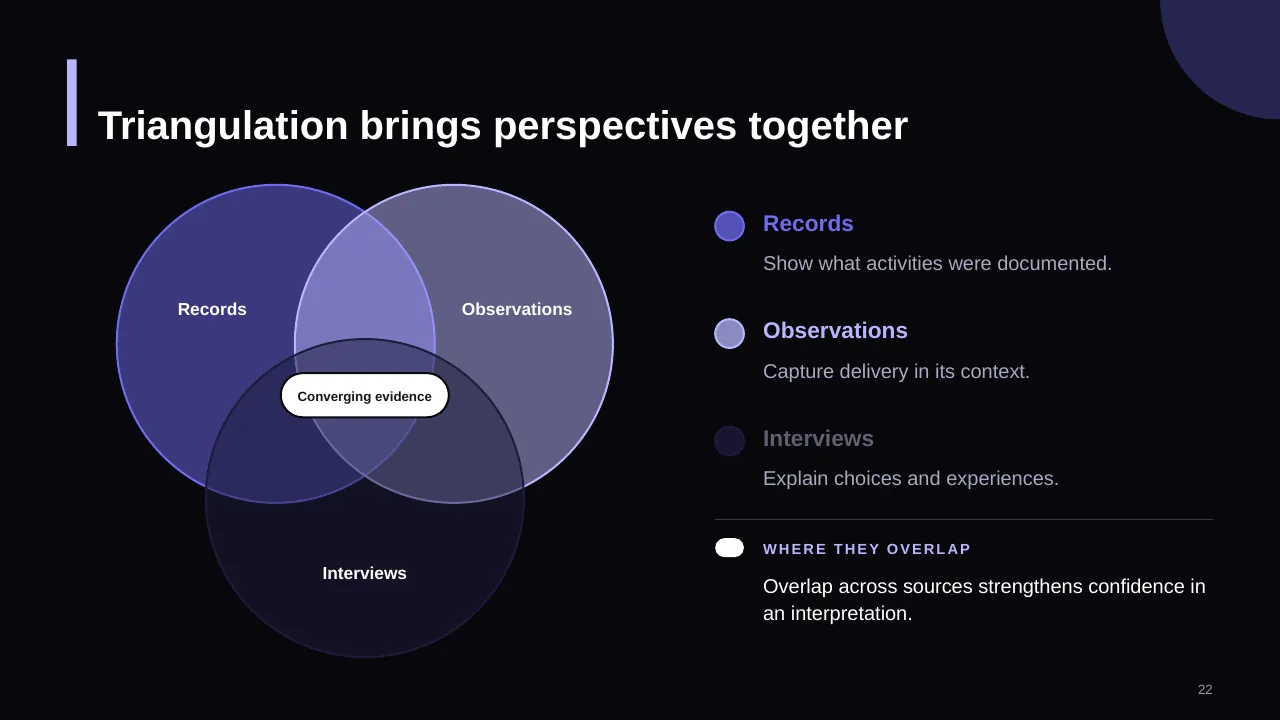
| 22 | Triangulation brings perspectives together |
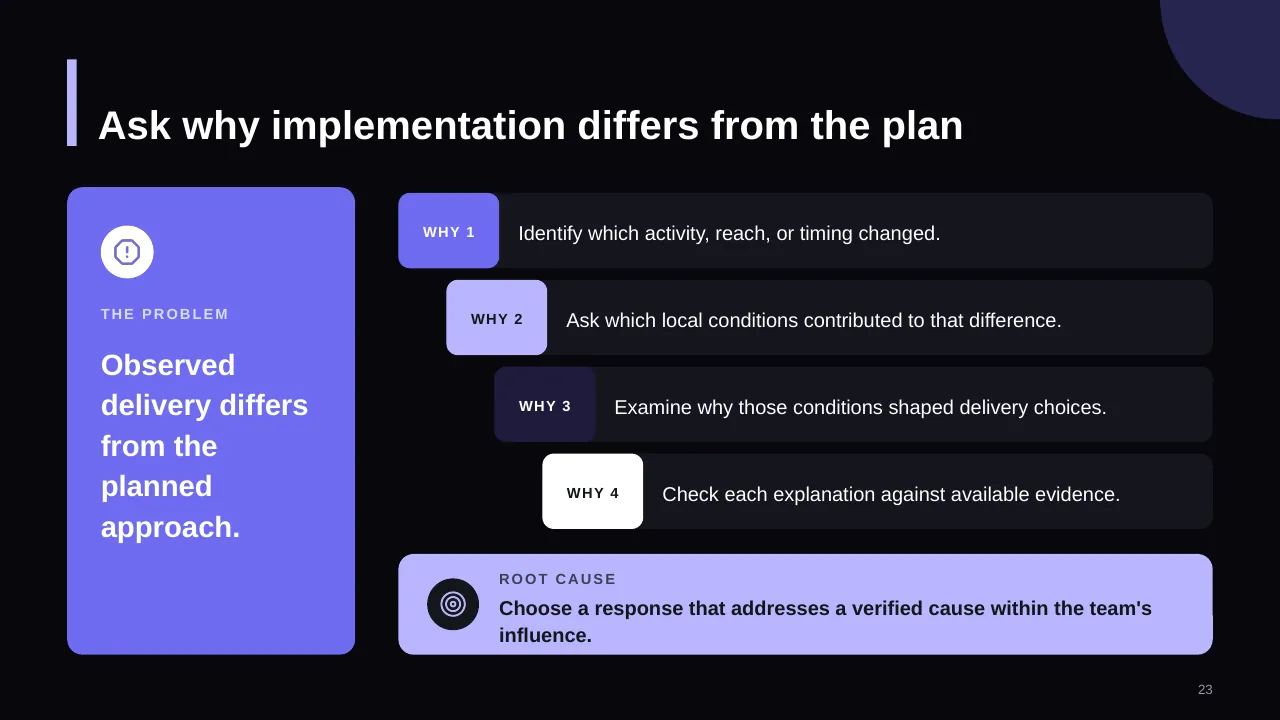
| 23 | Observed delivery differs from the planned approach. |
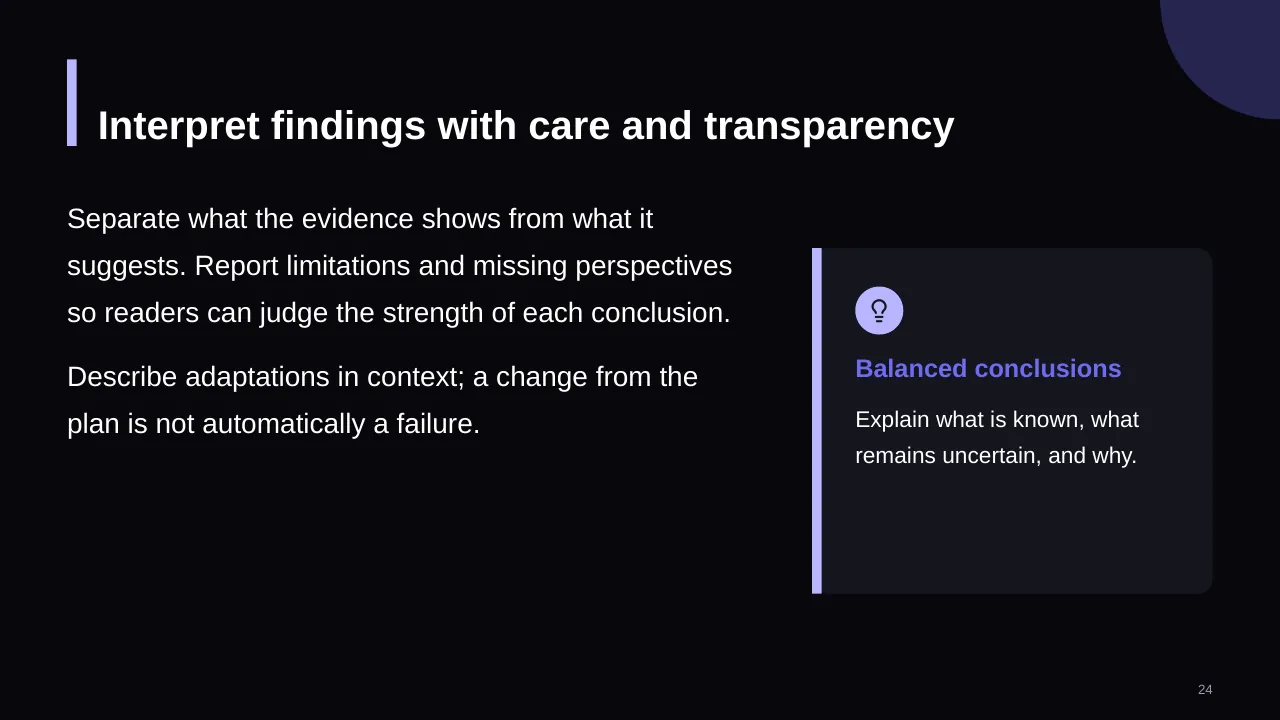
| 24 | Separate what the evidence shows from what it suggests. Report limitations and missing perspectives so… |
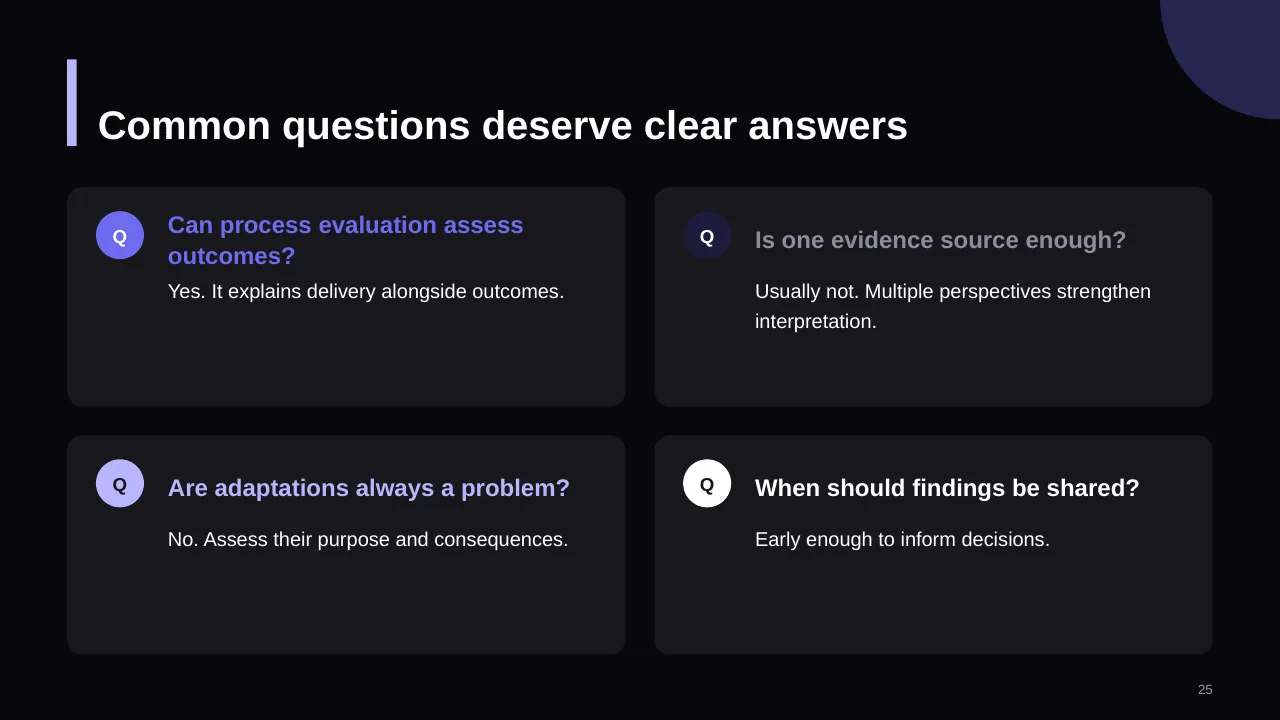
| 25 | Can process evaluation assess outcomes? |
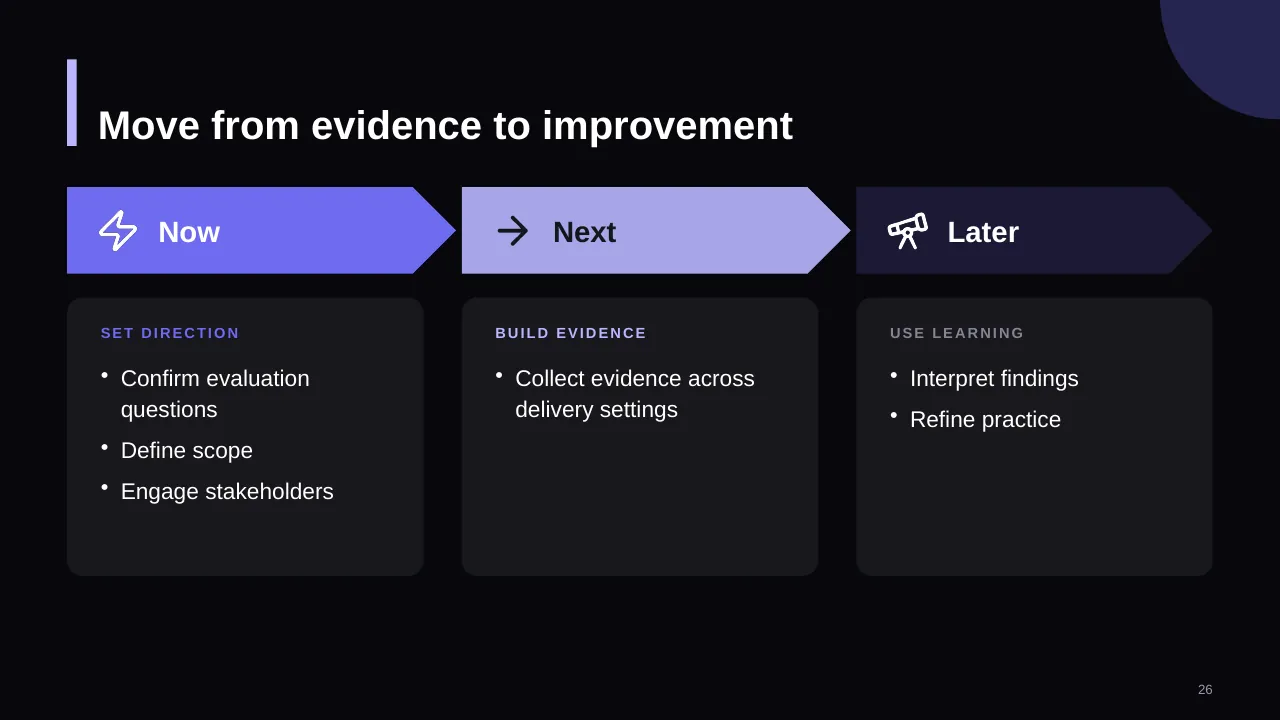
| 26 | Move from evidence to improvement |
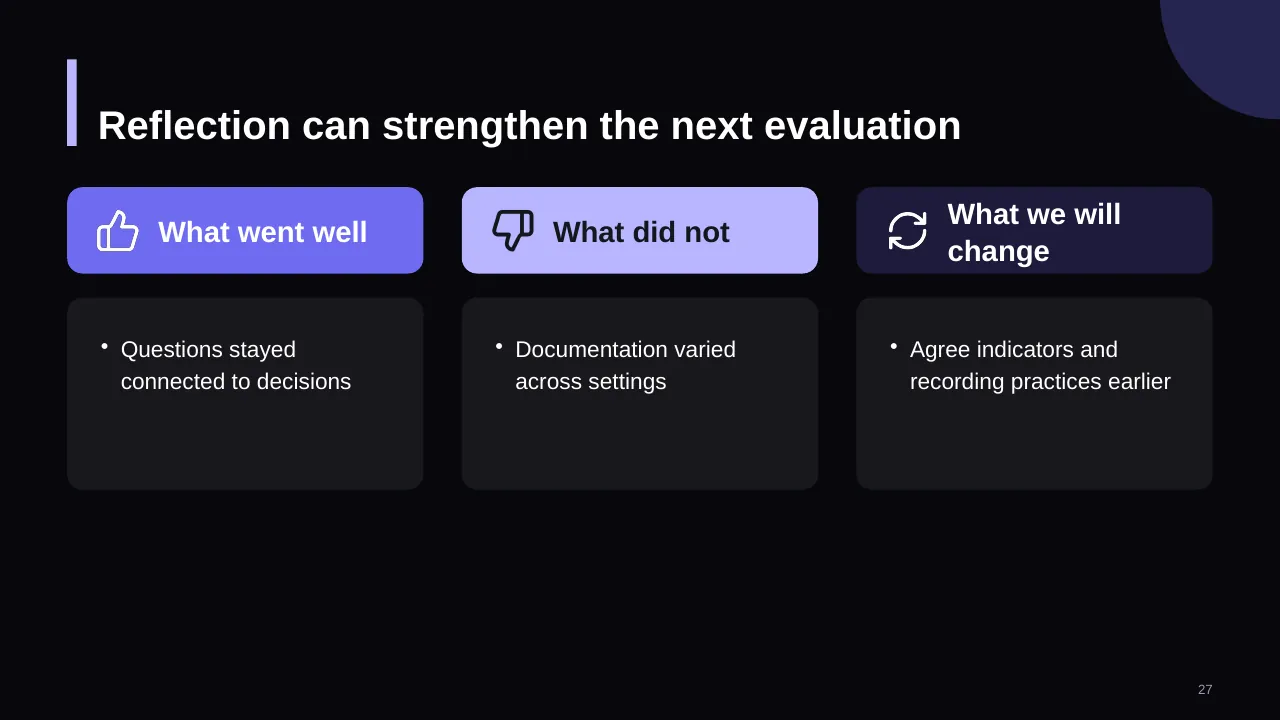
| 27 | Reflection can strengthen the next evaluation |
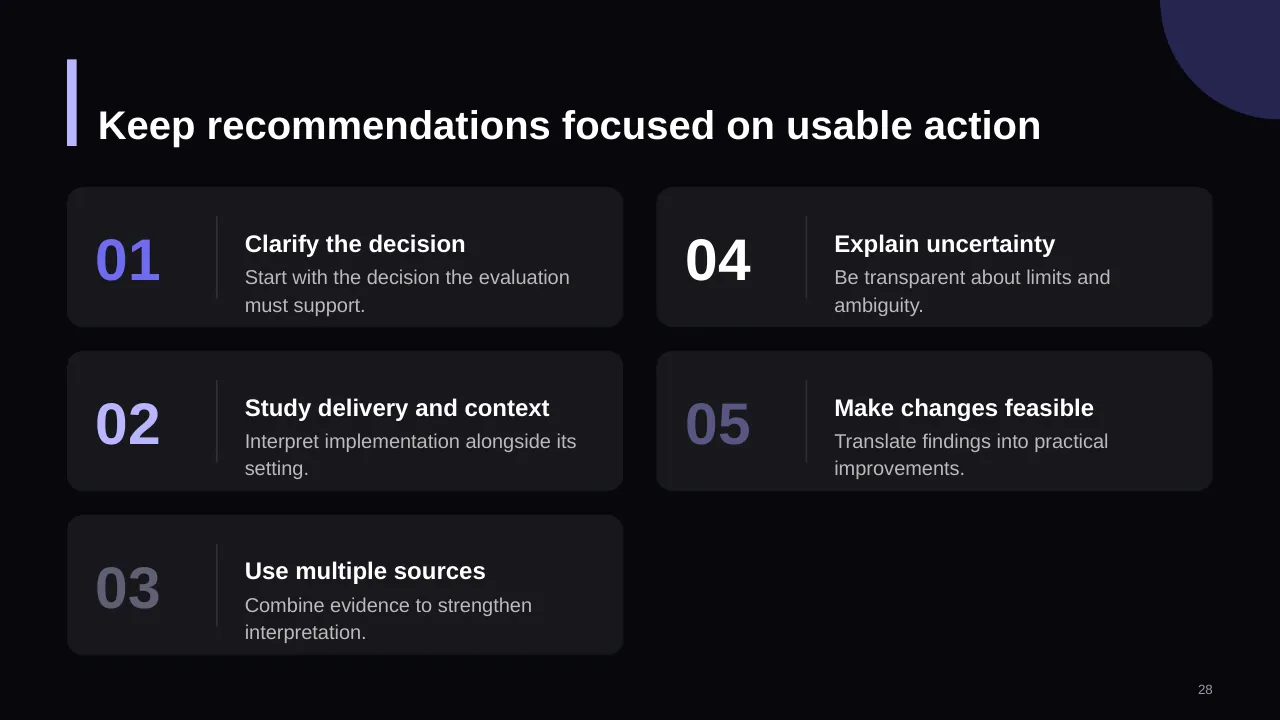
| 28 | Keep recommendations focused on usable action |
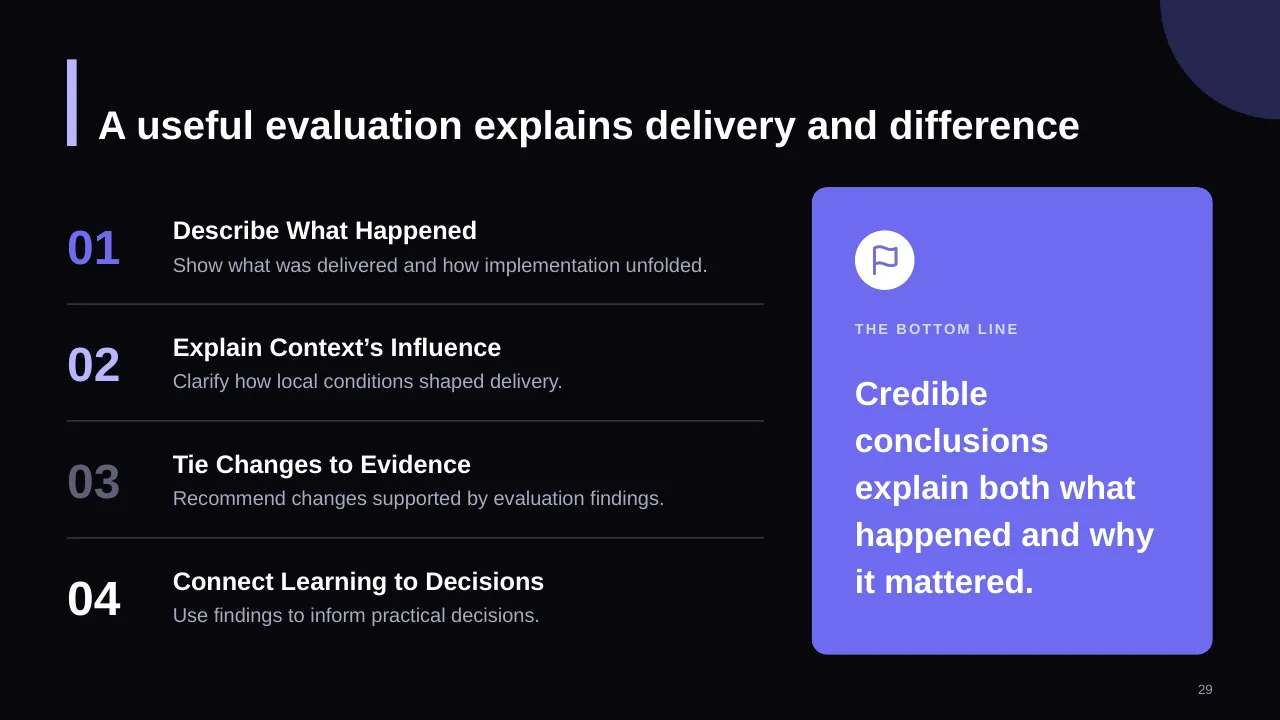
| 29 | A useful evaluation explains delivery and difference |
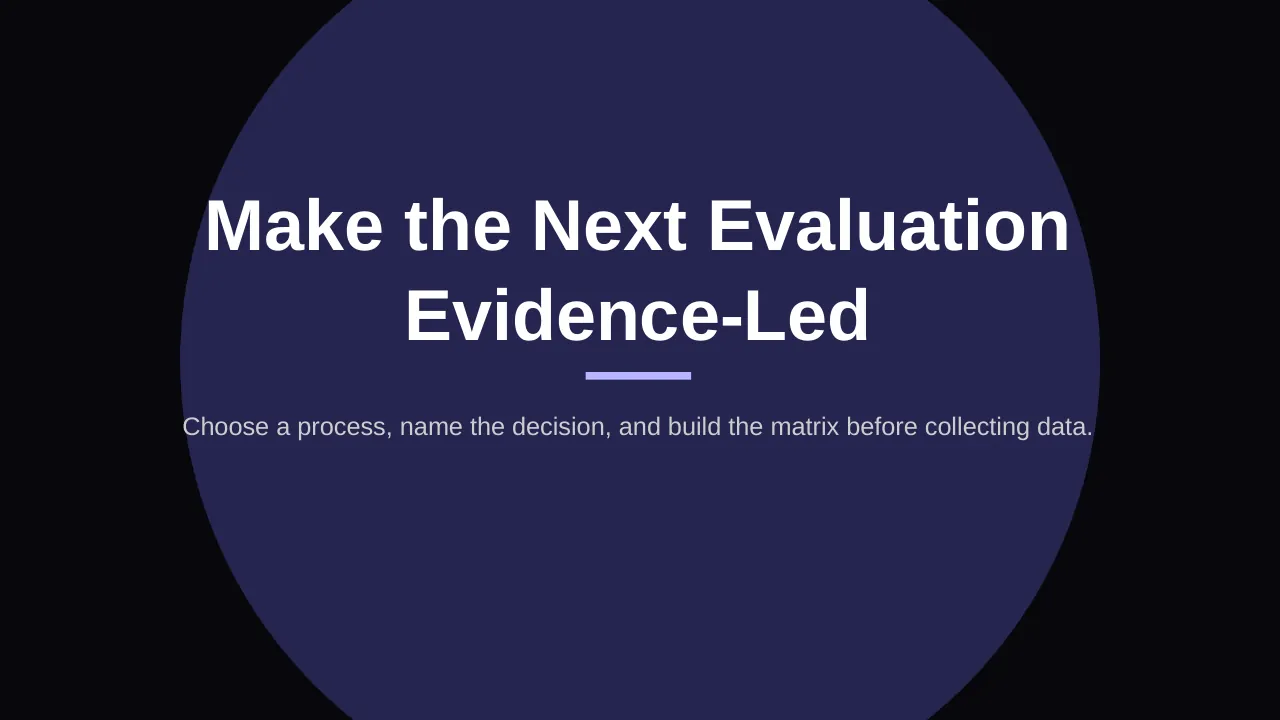
| 30 | Choose a process, name the decision, and build the matrix before collecting data. |
Tips for an operations presentation
- Map the process before proposing fixes.
- Quantify waste in time or money.
- Pick a few initiatives and give each an owner.
- Track results against a baseline.
Mistakes to avoid
- Fixes without a baseline
- Too many initiatives
- No process owner
Checklist before you present
- Is the current baseline shown?
- Is the process mapped?
- Are improvement areas prioritised?
- Do initiatives have owners?
- Are targets and reviews set?
Great for
- Operations reviews
- Process improvement projects
- Supply chain and logistics planning
- Risk and quality management
How to customise it
- Download the ZIP file and unzip it to get the .pptx presentation.
- Open it in PowerPoint, or upload it to Google Drive and open it with Google Slides.
- Replace the sample text and numbers with your own; charts update from their data sheets.
- Change the theme colours once to recolour the whole deck, then delete any slides you don't need.
Questions about an operations presentation
What is operational excellence?
A way of running operations that focuses on consistent, efficient delivery and continuous improvement, often using Lean or Six Sigma methods.
How do I evaluate a business process?
Measure it (time, cost, quality), map the steps, find bottlenecks and waste, then score improvement options by impact and effort.
Related presentations
- Operational Excellence Plan PPT Template
- Enterprise Risk Management PPT Template
- Business Process Evaluation PPT Template
- Business Operational Excellence Strategy PPT Template
Browse all Operations & Supply Chain presentations or more business PowerPoint templates.
Template details
| Template | Process Evaluation Matrix PPT Template |
|---|---|
| Categories | Business PowerPoint Templates, Operations & Supply Chain |
| File format | PowerPoint (.pptx), delivered as a .zip file |
| Number of slides | 30 fully editable slides |
| File size | 2.3 MB |
| Slide size | 16:9 widescreen |
| Preview images | 30 |
| Editable | Yes: text, colours, shapes, icons and charts |
| Works with | PowerPoint 2010 and later, PowerPoint for Mac, Google Slides |
| Licence | Royalty-free, yours to keep using after your plan ends (terms of use apply) |
| Price | Included in every SlideVilla plan |
| Added | 6 Sept 2025 |
Questions about this template
Can I edit the Process Evaluation Matrix PPT Template?
Yes. Every part of the Process Evaluation Matrix PPT Template is made with native PowerPoint shapes and text boxes, so you can change the wording, colours, fonts and sizes, move or delete elements, and swap icons without losing quality.
Does the Process Evaluation Matrix PPT Template work in Google Slides?
Yes. Download the .zip file, unzip it to get the .pptx, upload it to Google Drive and open it with Google Slides. The layout, shapes and text stay editable there too.
Is the Process Evaluation Matrix PPT Template free?
It is a premium template, included in every SlideVilla plan together with the rest of the library. See plans and pricing.
What size and format is it?
It is a PPTX file in 16:9 widescreen format with 30 slides, 2.3 MB (downloaded as a .zip; unzip it to get the presentation), with 30 preview images shown above.
How to use this template
- Step 1DownloadClick Download, then unzip the .zip file to get the .pptx presentation.
- Step 2OpenOpen it in PowerPoint, or upload it to Google Slides from your Drive.
- Step 3Make it yoursChange text, colours, icons and charts. Every element is fully editable.
Tags
Related PowerPoint templates
More designs like this one, ready to edit.