About this PowerPoint template
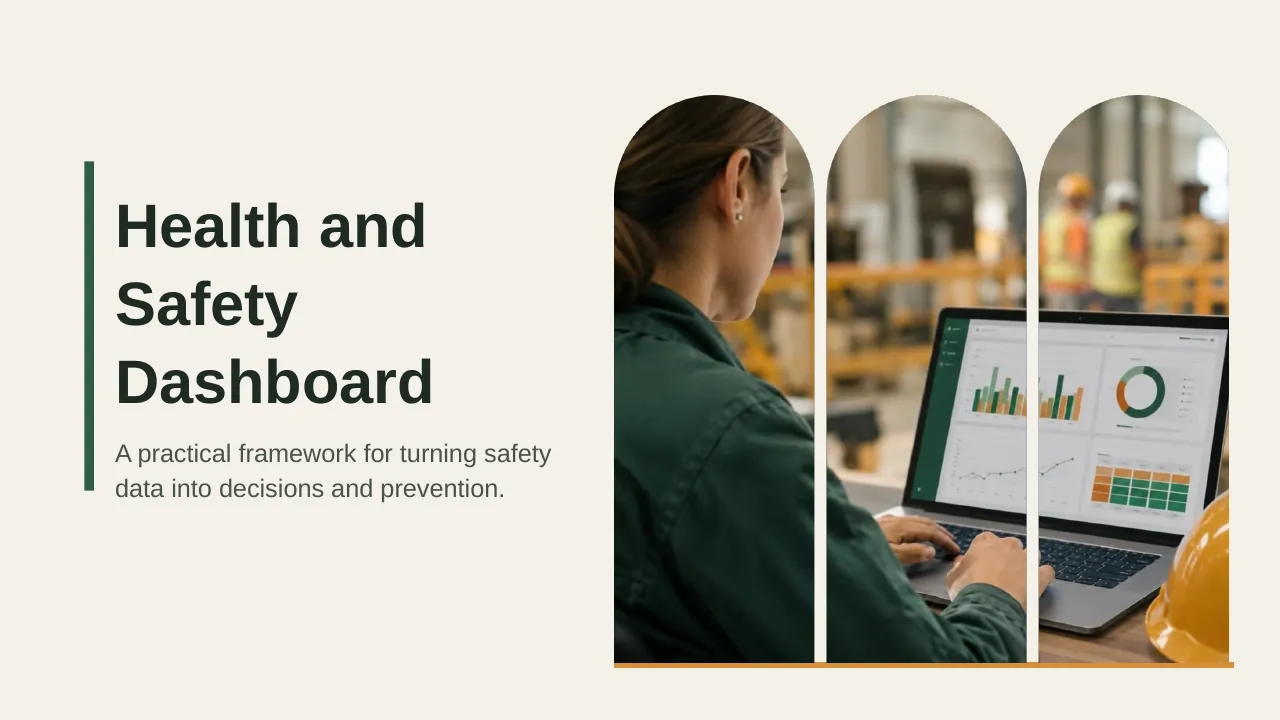
The Health and Safety Dashboard PowerPoint Template is a complete 20-slide presentation: a practical framework for turning safety data into decisions and prevention. Every slide is fully editable in PowerPoint and Google Slides, so you can change the text, colours, charts and icons to fit your brand in minutes.
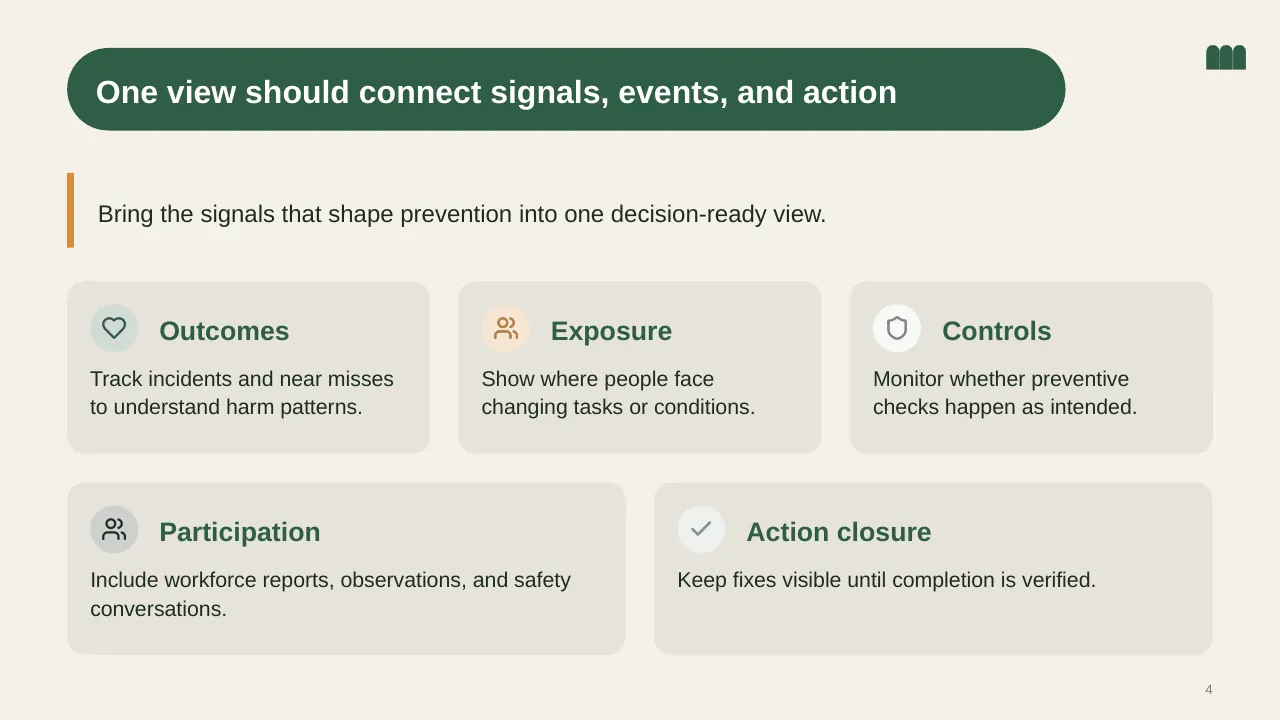
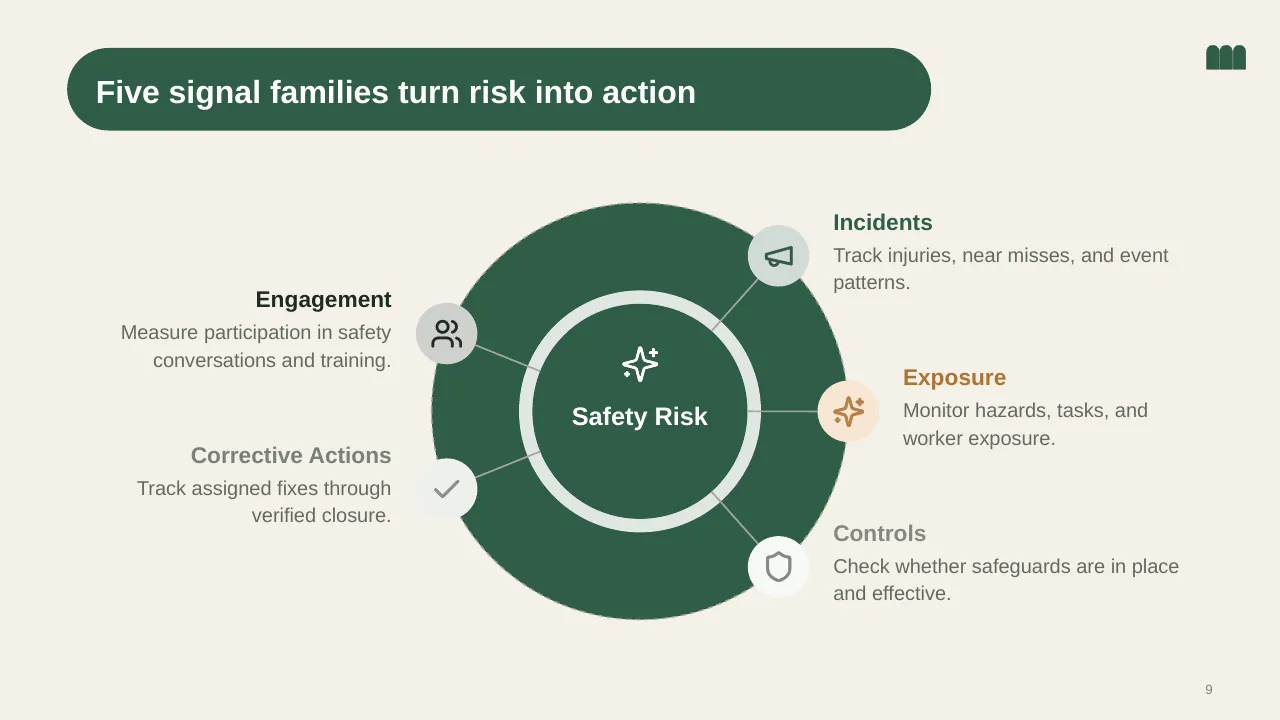
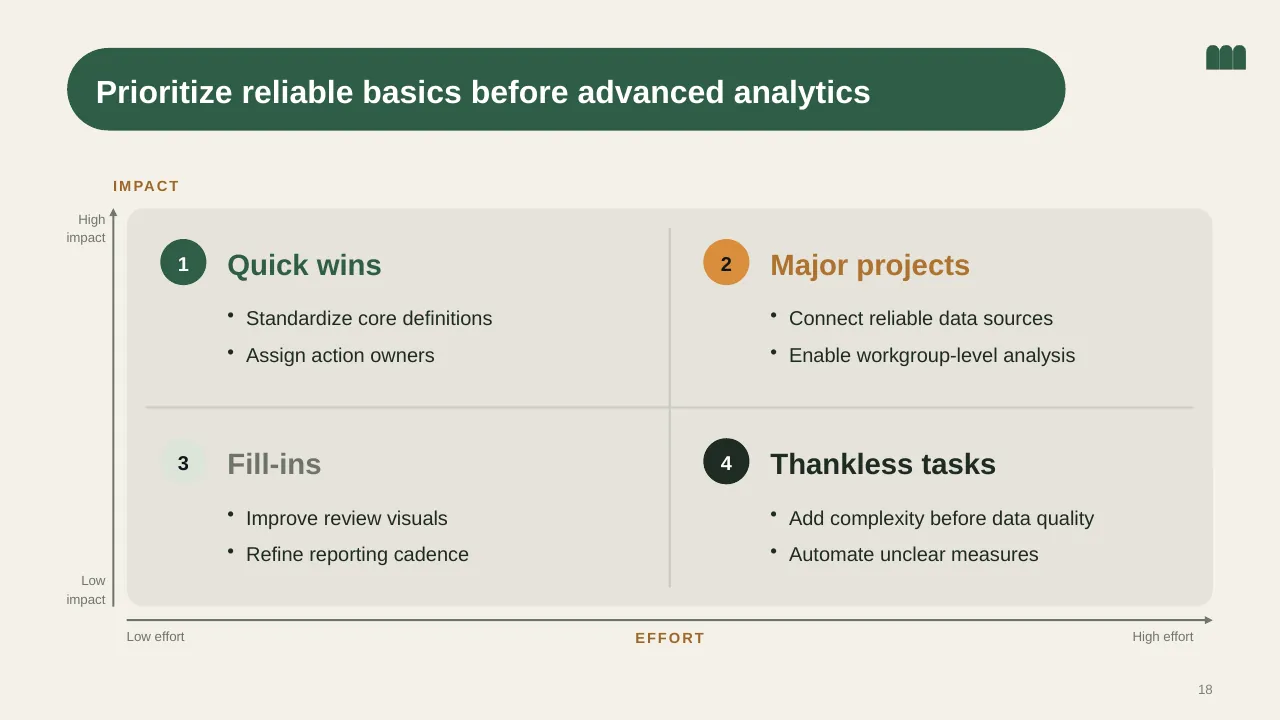
Inside, the slides walk through topics such as “Bring the signals that shape prevention into one decision-ready view”, “Five signal families turn risk into action” and “Prioritize reliable basics before advanced analytics”, with ready-made layouts for each step. It is part of our KPI Dashboards presentations.
On this page
What's included
- 20 professionally designed 16:9 widescreen slides
- 100% editable text, shapes, icons, tables and charts (no flat images)
- Works in Microsoft PowerPoint (Windows and Mac) and Google Slides
- Clean, consistent layout that follows your theme colours and fonts
- Delivered as a single ZIP file containing the .pptx presentation
What to include in a KPI dashboard
A simple structure that works for most audiences, mapped to the slides in this deck:
| Part | What goes there | Slide in this deck |
|---|---|---|
| Headline KPIs | The four to six numbers that matter most | Use any content slide |
| Trends | How each KPI moved over time | Use any content slide |
| Breakdown | By team, region, product or category | Slide 16 |
| Targets and status | Actual vs target with clear status colours | Use any content slide |
| Actions | What the numbers mean and what happens next | Slides 2, 9, 11 |
Key numbers: Data quality and governance
Research figures you can quote on your slides. Each one names the study it comes from, so your audience can check it.
| Finding | Figure | Source |
|---|---|---|
| Average yearly cost of poor data quality per organisation | $12.9 million | Gartner (2020 research) |
| Organisations that do not measure data quality | 59% | Gartner survey |
| Share of marketing data CMOs estimate is poor quality | 45% | Adverity, State of Play (2025) |
| Finance leaders naming data quality and availability as their top FP&A bottleneck | 58% | Vena, FP&A Impact Report (2026) |
Sources: Gartner, Data Quality · IBM, What is data quality · Adverity, data quality research 2025 · Vena, FP&A trends. Figures are from the editions named; check for a newer edition before you present.
Slide-by-slide outline
| Slide | What it covers |
|---|---|
| 1 | Title slide: Health and Safety Dashboard |
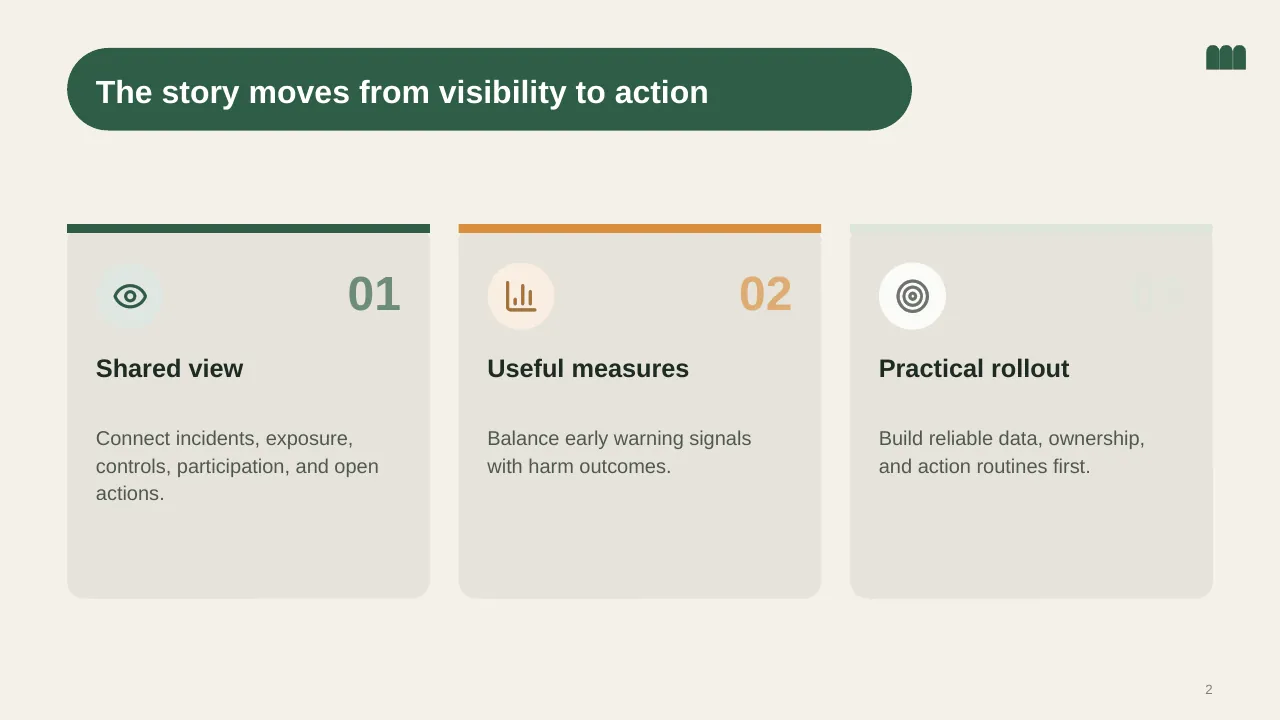
| 2 | The story moves from visibility to action |
| 3 | Spot changing conditions, then guide timely prevention before harm occurs. |
| 4 | Bring the signals that shape prevention into one decision-ready view. |
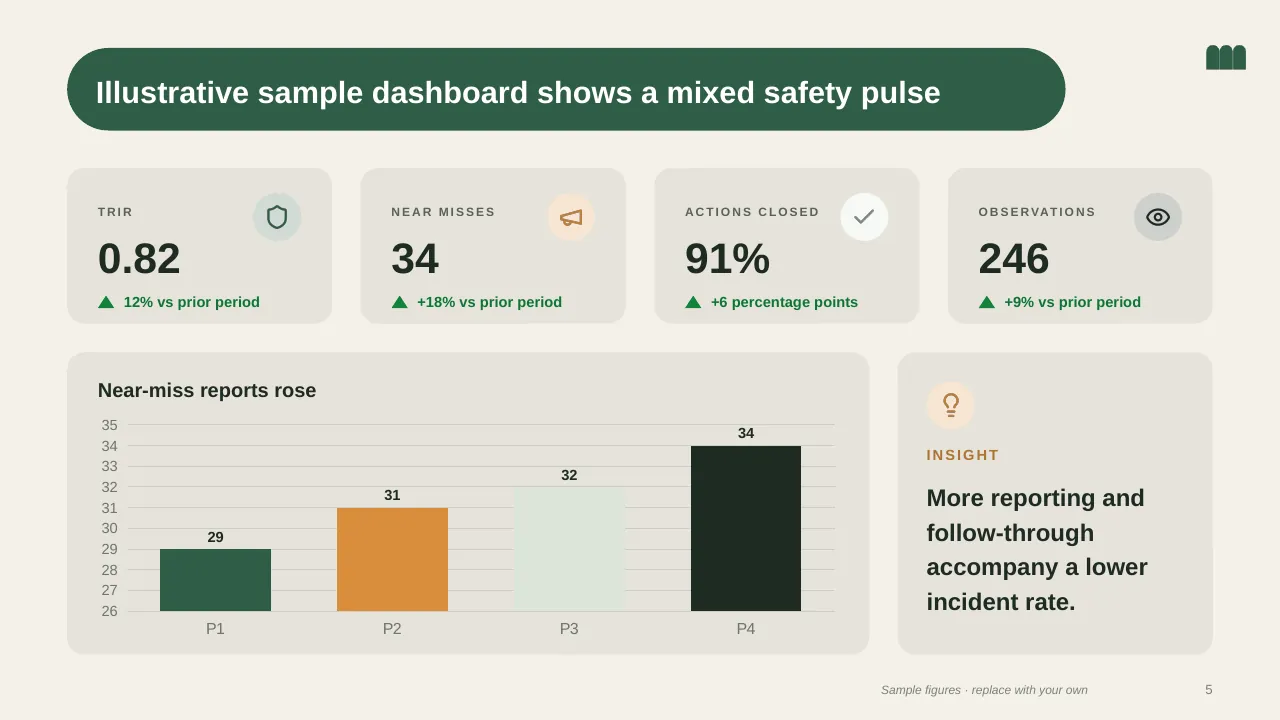
| 5 | Illustrative sample dashboard shows a mixed safety pulse |
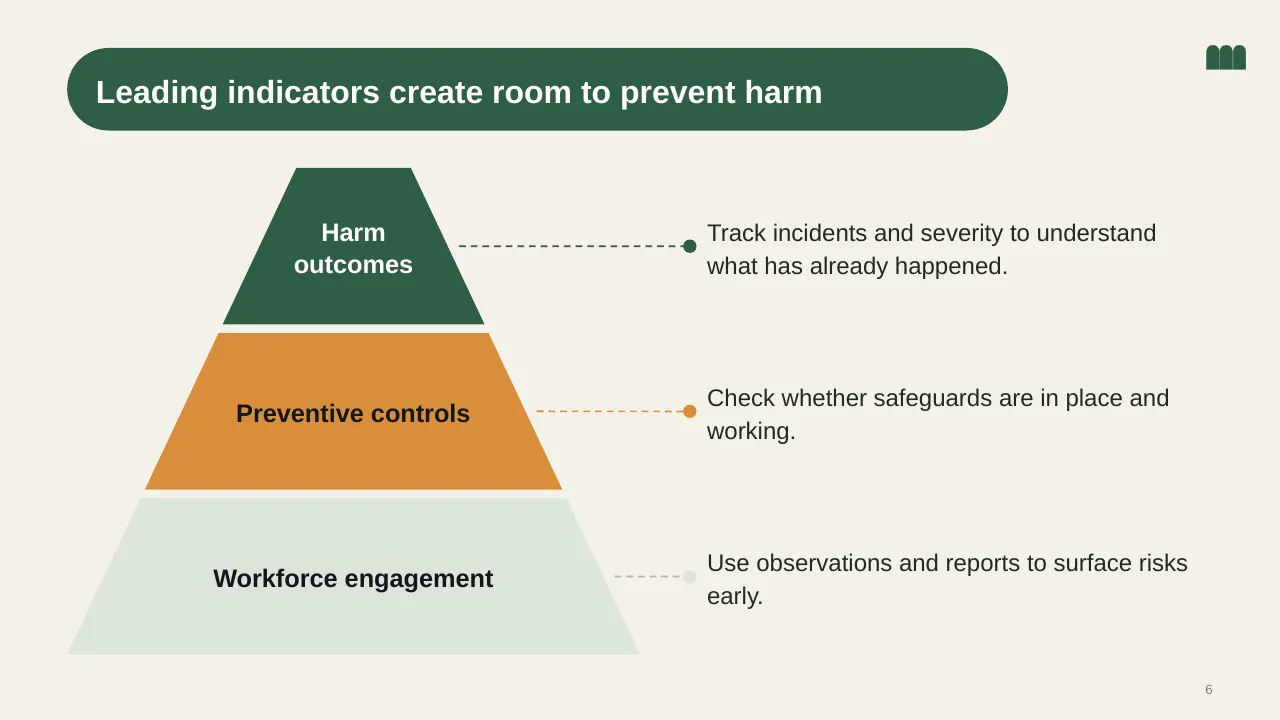
| 6 | Track incidents and severity to understand what has already happened. |
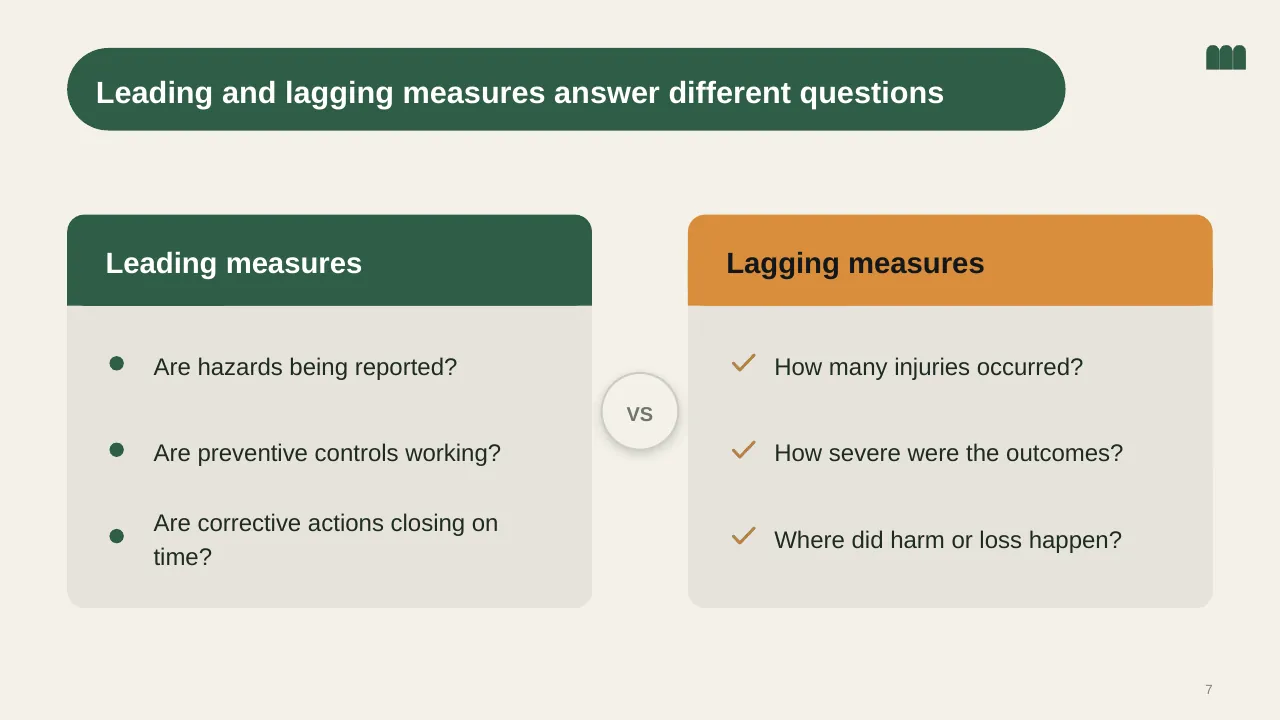
| 7 | Leading and lagging measures answer different questions |
| 8 | Set review rhythms, assign owners, and respond to emerging risks. |
| 9 | Five signal families turn risk into action |
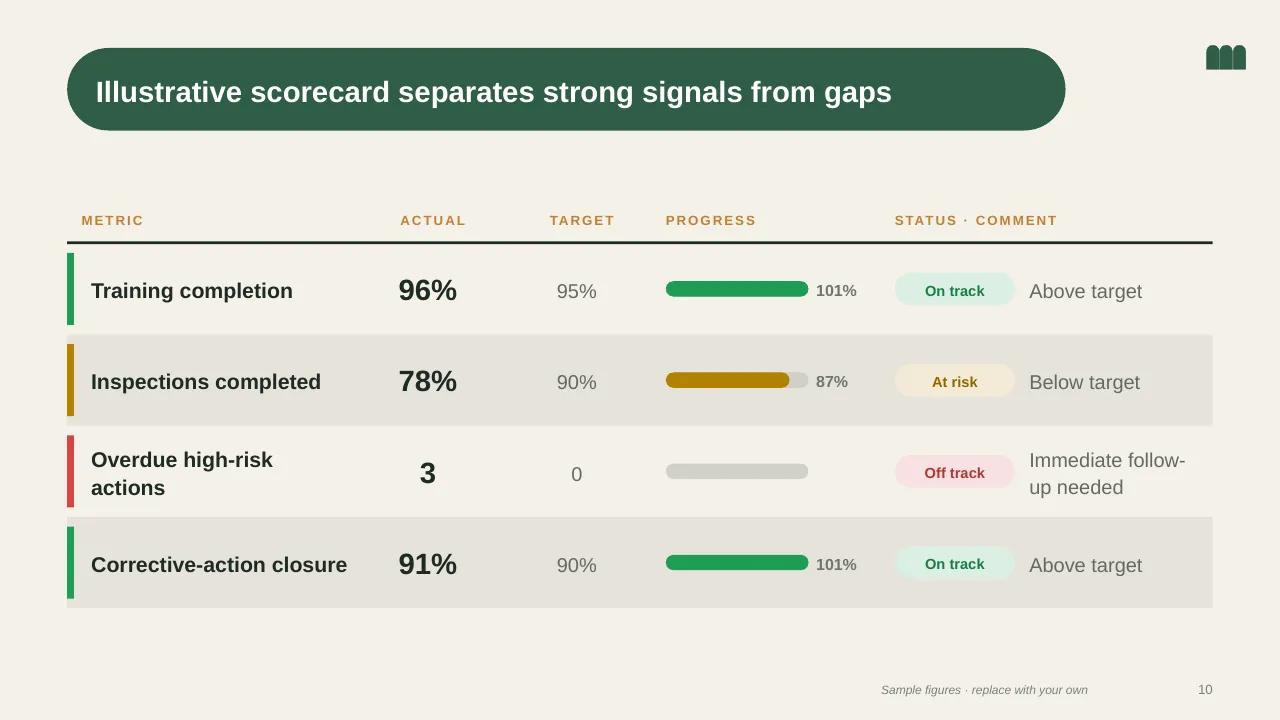
| 10 | Illustrative scorecard separates strong signals from gaps |
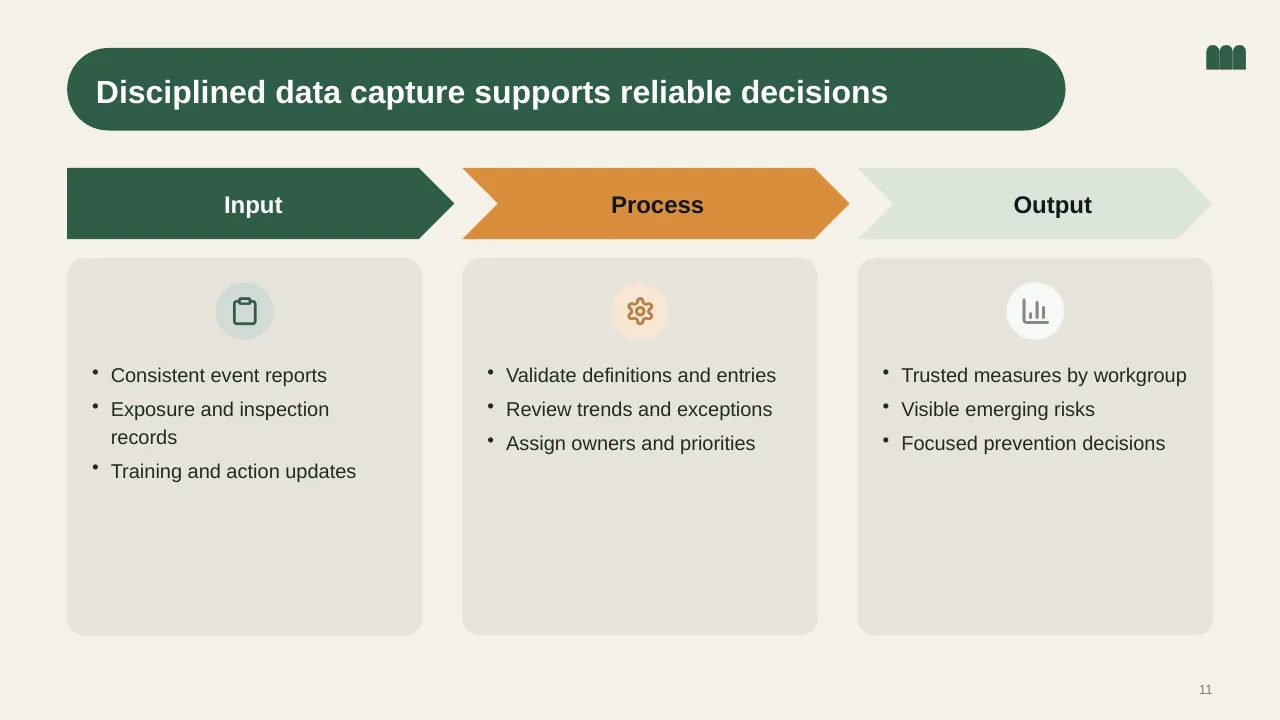
| 11 | Consistent event reports Exposure and inspection records Training and action updates |
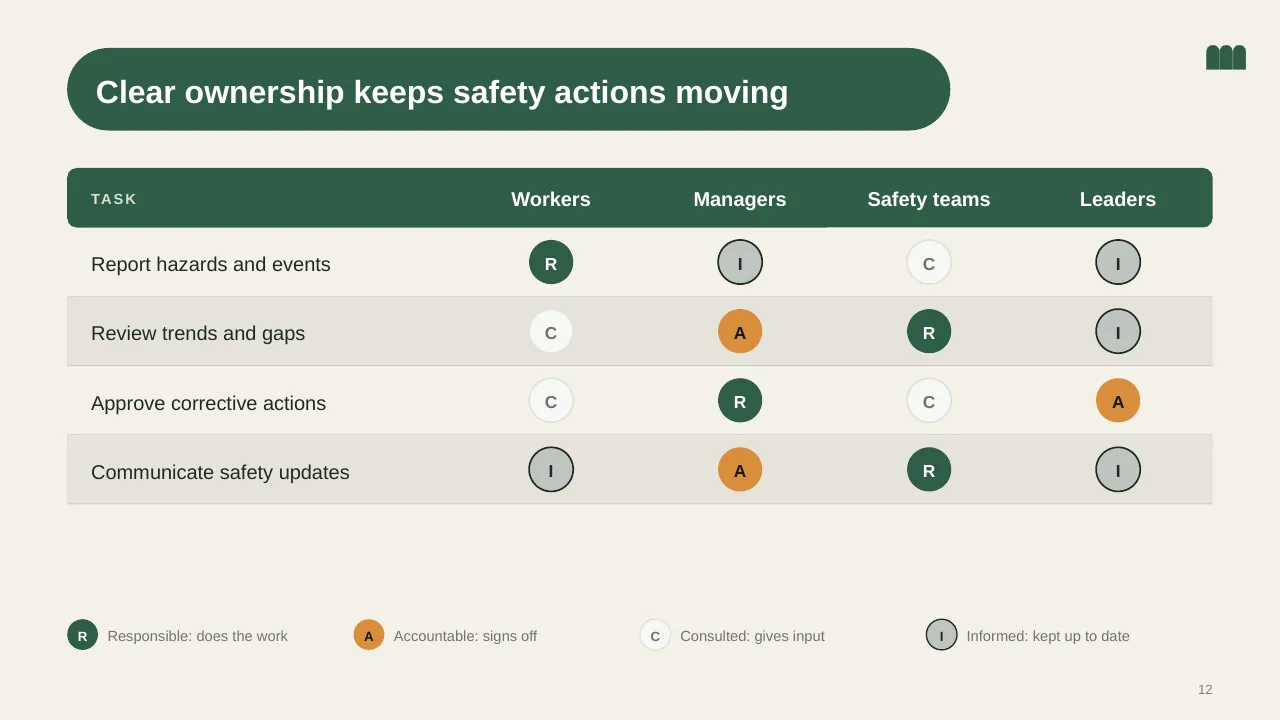
| 12 | Clear ownership keeps safety actions moving |
| 13 | Consistent definitions, transparent data, and practical frontline adoption. |
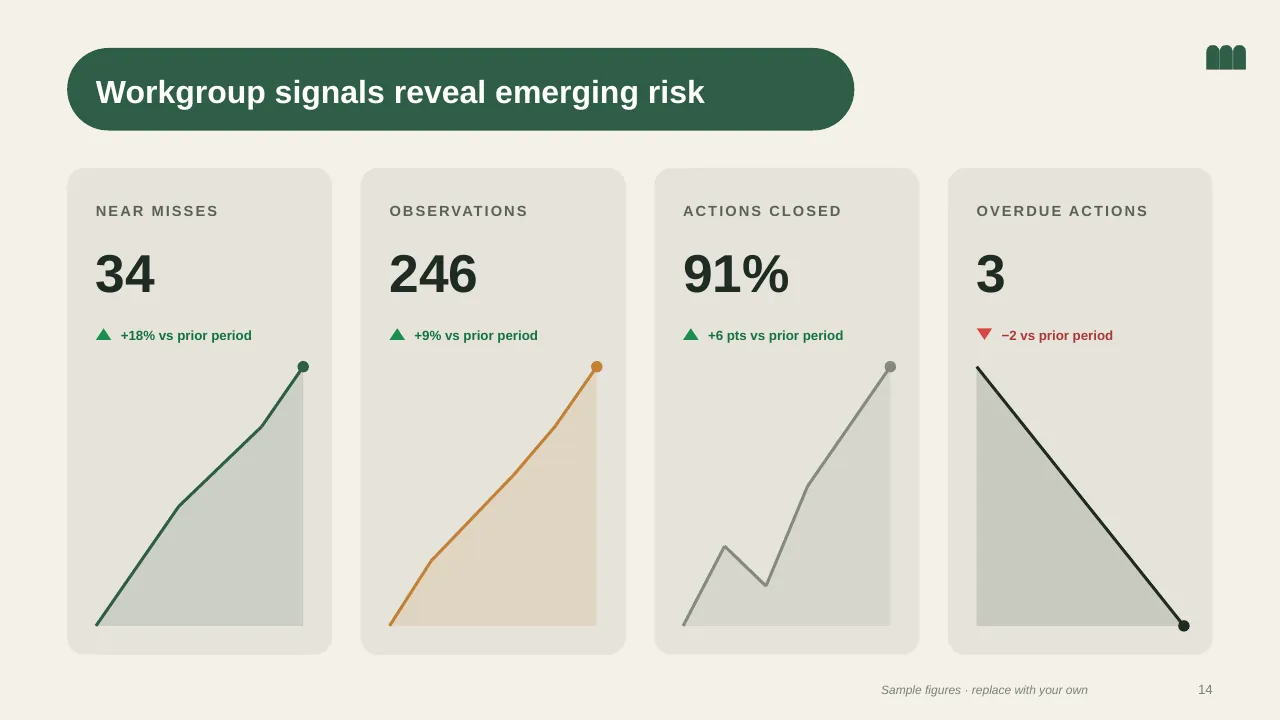
| 14 | Workgroup signals reveal emerging risk |
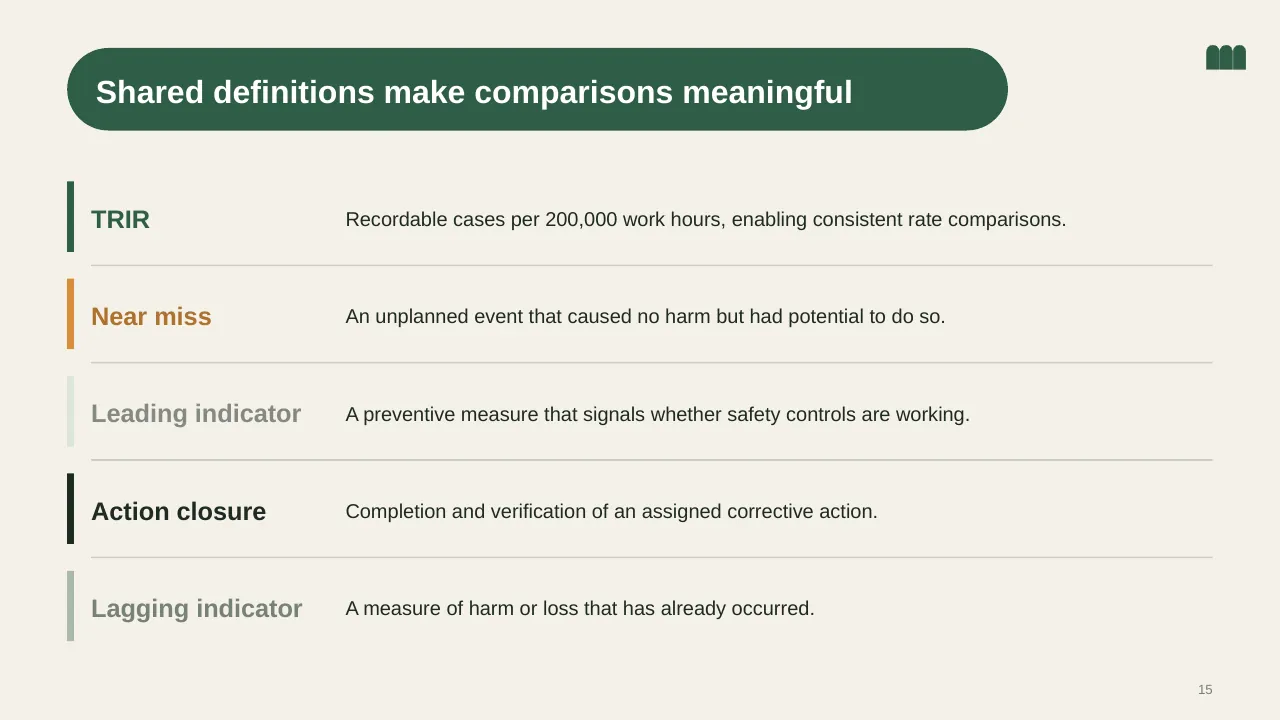
| 15 | Recordable cases per 200,000 work hours, enabling consistent rate comparisons. |
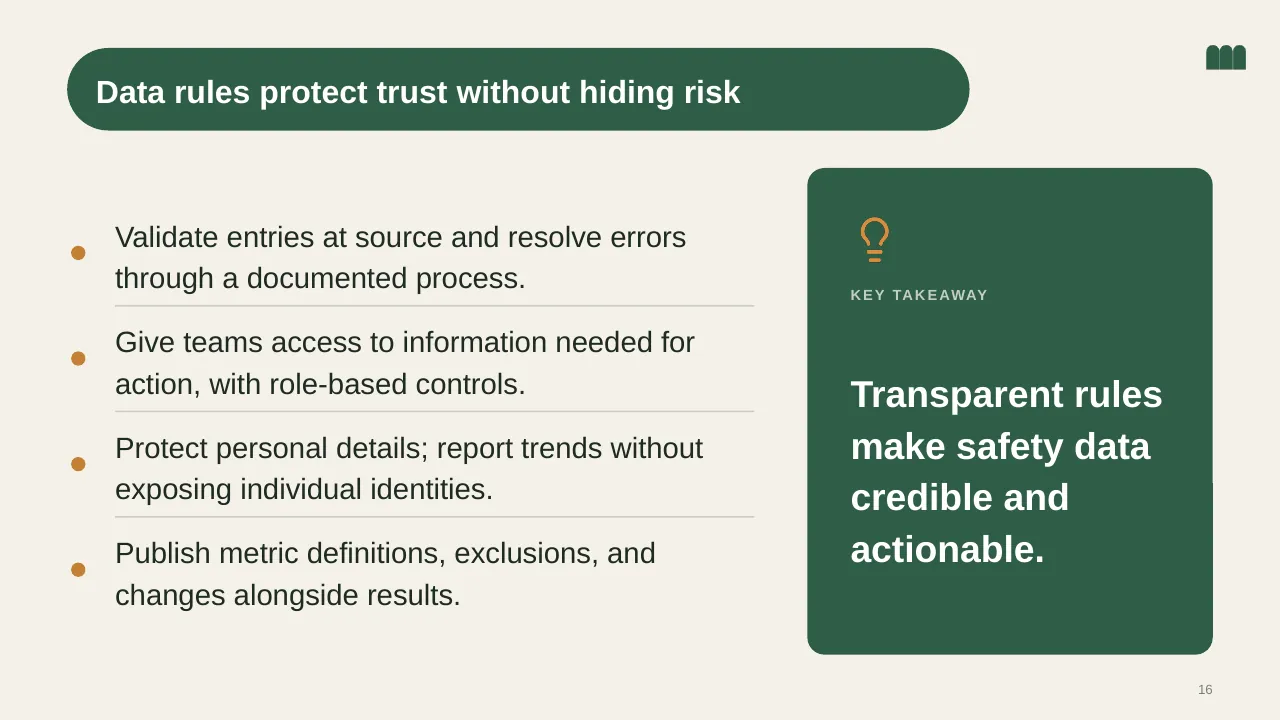
| 16 | Give teams access to information needed for action, with role-based controls. |
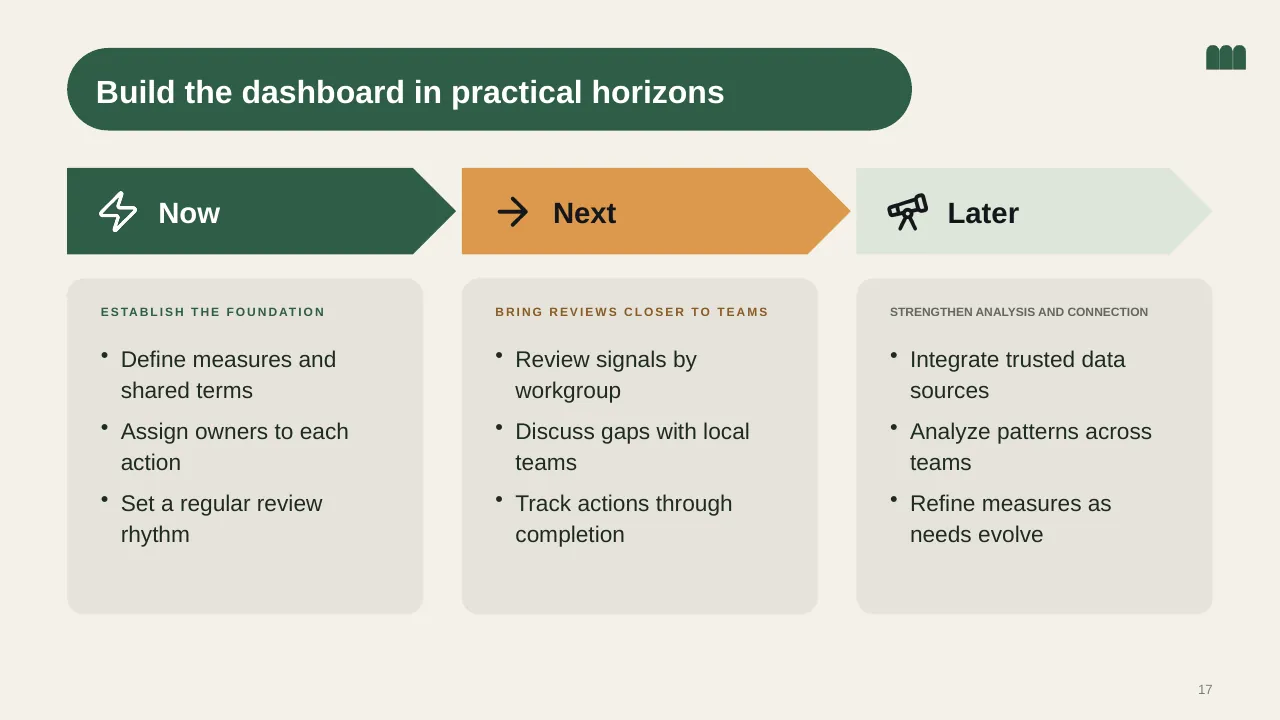
| 17 | Build the dashboard in practical horizons |
| 18 | Prioritize reliable basics before advanced analytics |
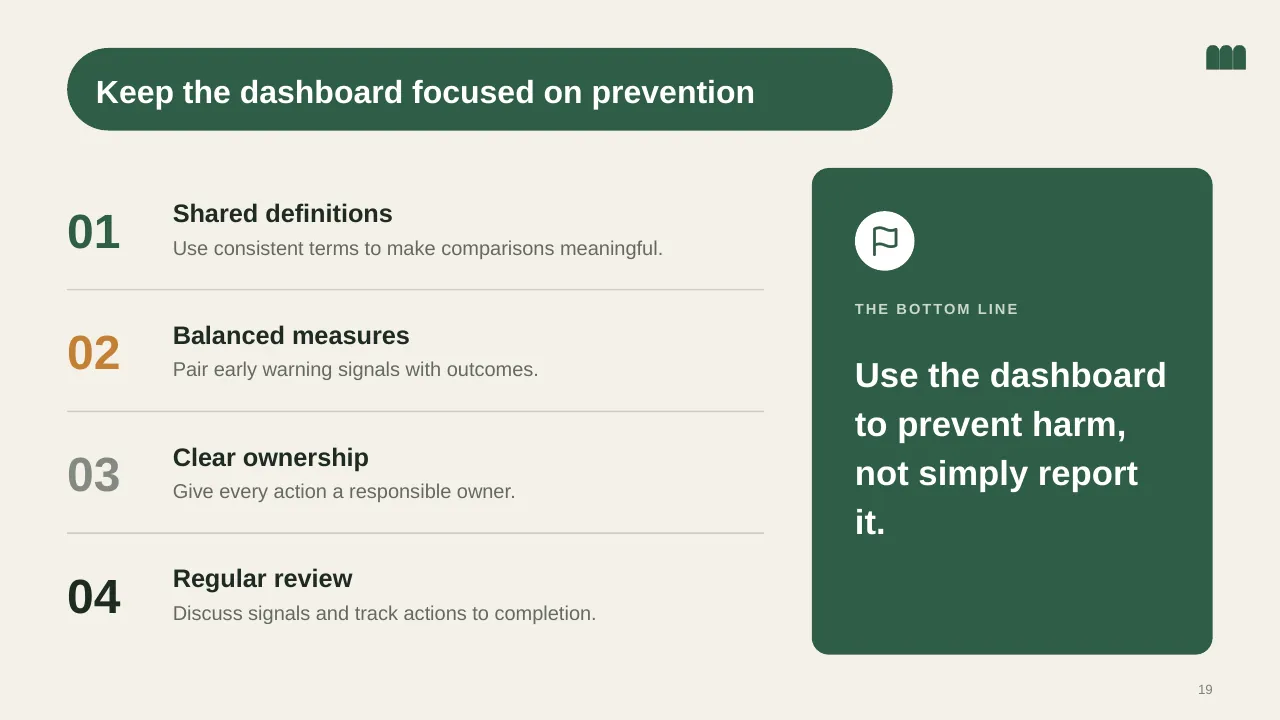
| 19 | Keep the dashboard focused on prevention |
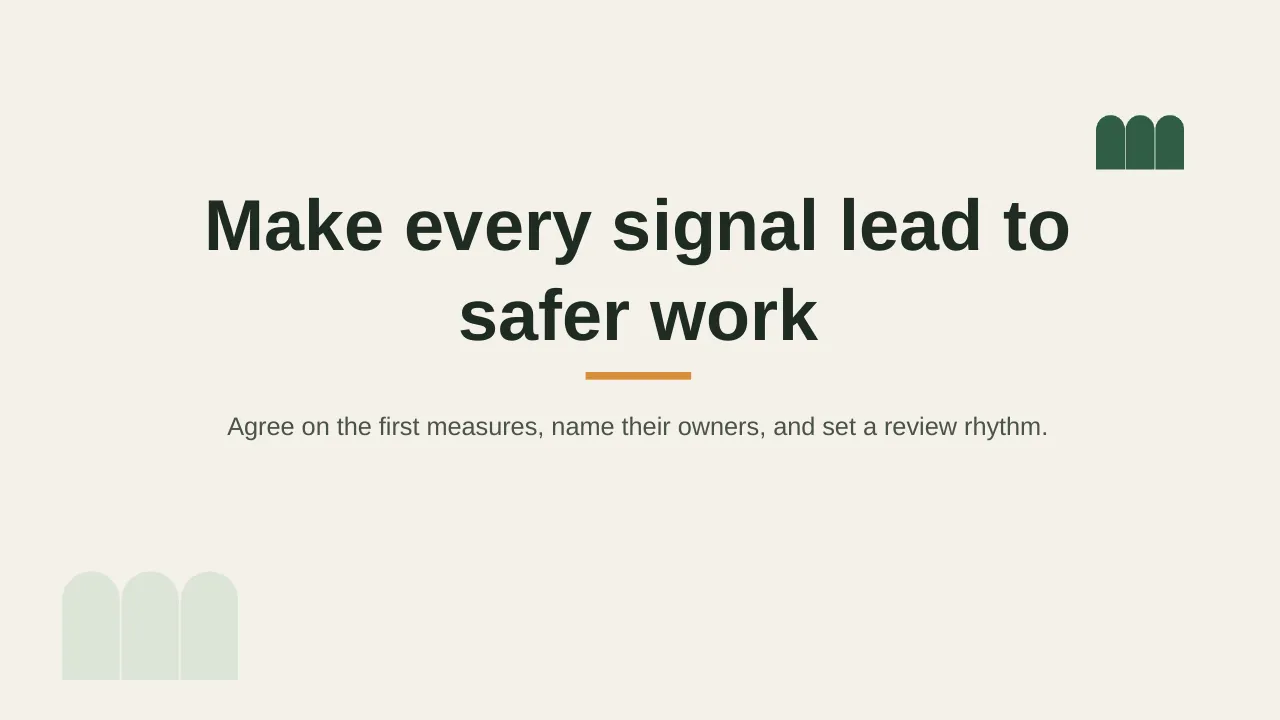
| 20 | Agree on the first measures, name their owners, and set a review rhythm. |
Tips for a KPI dashboard
- Limit the top row to the few KPIs your audience acts on.
- Always show a comparison: target, last period or benchmark.
- Use the same colours for the same meaning on every slide.
- Add one line of commentary per chart: what changed and why.
Mistakes to avoid
- Too many charts on one slide
- Numbers with no target or trend
- Inconsistent definitions between reports
Checklist before you present
- Are KPIs defined the same way as last time?
- Is each number compared with something?
- Are status colours consistent?
- Is the data date shown?
- Is there one clear takeaway per chart?
Great for
- Monthly performance reviews
- Management and board reporting
- Project and portfolio tracking
- HR, finance and operations metrics
How to customise it
- Download the ZIP file and unzip it to get the .pptx presentation.
- Open it in PowerPoint, or upload it to Google Drive and open it with Google Slides.
- Replace the sample text and numbers with your own; charts update from their data sheets.
- Change the theme colours once to recolour the whole deck, then delete any slides you don't need.
Questions about a KPI dashboard
How many KPIs should a dashboard show?
For a summary slide, four to six. Put detail on drill-down slides so the headline stays readable.
How do I update the charts?
Right-click a chart in PowerPoint and choose Edit Data; the chart redraws from the numbers you enter.
Related presentations
- HR Dashboard Employee Headcount PowerPoint Template
- Business Performance Dashboard PowerPoint Template
- Maintenance Dashboard PowerPoint Template
- Agile HR Transformation KPI Dashboard PowerPoint Template
Browse all KPI Dashboards presentations or more dashboard templates.
Template details
| Template | Health and Safety Dashboard PowerPoint Template |
|---|---|
| Categories | Dashboards, KPI Dashboards |
| File format | PowerPoint (.pptx), delivered as a .zip file |
| Number of slides | 20 fully editable slides |
| File size | 2.3 MB |
| Slide size | 16:9 widescreen |
| Preview images | 20 |
| Editable | Yes: text, colours, shapes, icons and charts |
| Works with | PowerPoint 2010 and later, PowerPoint for Mac, Google Slides |
| Licence | Royalty-free, yours to keep using after your plan ends (terms of use apply) |
| Price | Included in every SlideVilla plan |
| Added | 17 Jan 2025 |
Questions about this template
Can I edit the Health and Safety Dashboard PowerPoint Template?
Yes. Every part of the Health and Safety Dashboard PowerPoint Template is made with native PowerPoint shapes and text boxes, so you can change the wording, colours, fonts and sizes, move or delete elements, and swap icons without losing quality.
Does the Health and Safety Dashboard PowerPoint Template work in Google Slides?
Yes. Download the .zip file, unzip it to get the .pptx, upload it to Google Drive and open it with Google Slides. The layout, shapes and text stay editable there too.
Is the Health and Safety Dashboard PowerPoint Template free?
It is a premium template, included in every SlideVilla plan together with the rest of the library. See plans and pricing.
What size and format is it?
It is a PPTX file in 16:9 widescreen format with 20 slides, 2.3 MB (downloaded as a .zip; unzip it to get the presentation), with 20 preview images shown above.
How to use this template
- Step 1DownloadClick Download, then unzip the .zip file to get the .pptx presentation.
- Step 2OpenOpen it in PowerPoint, or upload it to Google Slides from your Drive.
- Step 3Make it yoursChange text, colours, icons and charts. Every element is fully editable.
Categories
Tags
Related PowerPoint templates
More designs like this one, ready to edit.