About this PowerPoint template
The Gap Analysis PowerPoint Template is a complete 30-slide presentation: a practical approach to identifying and closing performance gaps. Every slide is fully editable in PowerPoint and Google Slides, so you can change the text, colours, charts and icons to fit your brand in minutes.
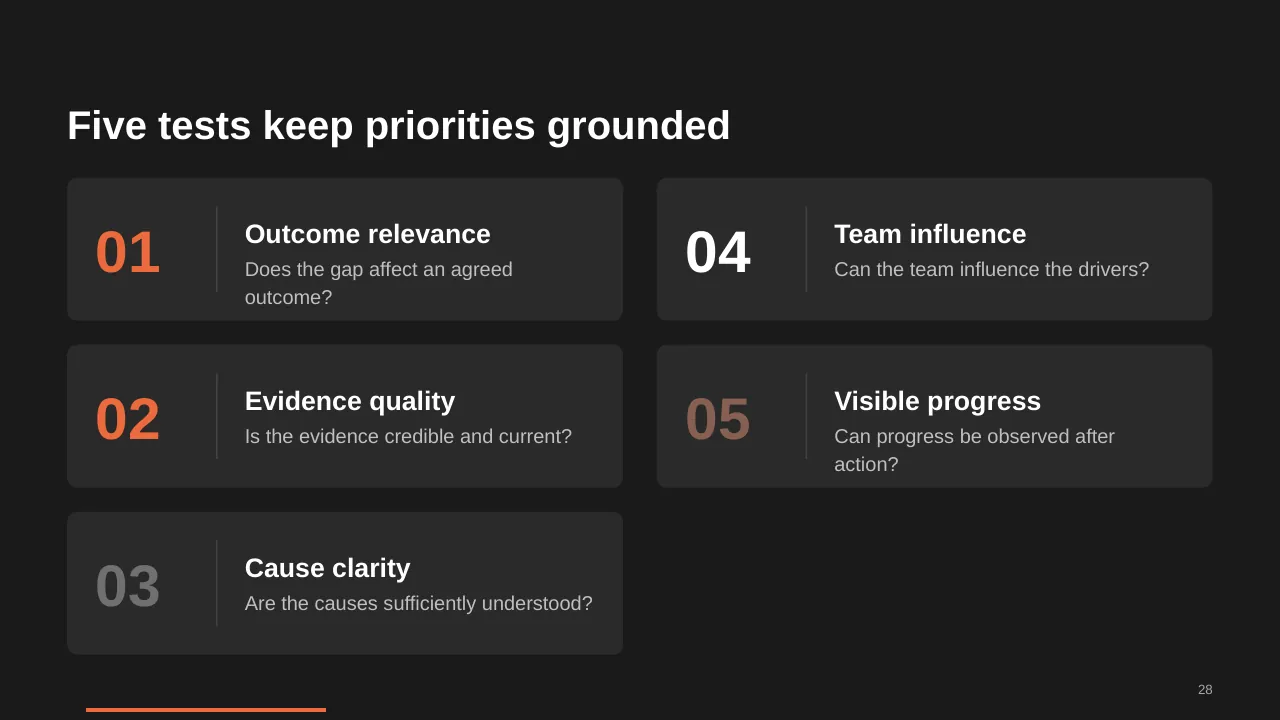
Inside, the slides walk through topics such as “Goals exist, but the distance remains unclear”, “Trace operational gaps across the value chain” and “Five tests keep priorities grounded”, with ready-made layouts for each step. It is part of our Business Strategy & Planning presentations.
On this page
What's included
- 30 professionally designed 16:9 widescreen slides
- 100% editable text, shapes, icons, tables and charts (no flat images)
- Works in Microsoft PowerPoint (Windows and Mac) and Google Slides
- Clean, consistent layout that follows your theme colours and fonts
- Delivered as a single ZIP file containing the .pptx presentation
What to include in a strategy presentation
A simple structure that works for most audiences, mapped to the slides in this deck:
| Part | What goes there | Slide in this deck |
|---|---|---|
| Where we are | Current position, results and context | Slides 3, 5, 6 |
| Where we want to go | Vision, mission and goals | Slides 4, 5, 26 |
| How we get there | Strategic pillars and initiatives | Slides 2, 3, 5 |
| Resources | People, budget and capabilities | Slides 9, 18, 27 |
| Measures | KPIs, milestones and review rhythm | Slides 3, 6, 9 |
Key numbers: Strategy execution
Research figures you can quote on your slides. Each one names the study it comes from, so your audience can check it.
| Finding | Figure | Source |
|---|---|---|
| Firms that struggle to bridge strategy and day-to-day implementation | 61% | Economist Intelligence Unit for PMI (2013) |
| Strategic initiatives that did not succeed over three years | 44% | Economist Intelligence Unit for PMI (2013) |
| Strategic initiatives that succeed when projects are highly aligned to strategy vs poorly | 65% vs 35% | PMI Pulse of the Profession (2014) |
| Leaders naming leadership buy-in as the top reason initiatives succeed | 51% | Economist Intelligence Unit for PMI (2013) |
Sources: PMI and EIU, Why Good Strategies Fail (press release) · PMI, Bridging the chasm. Figures are from the editions named; check for a newer edition before you present.
Slide-by-slide outline
| Slide | What it covers |
|---|---|
| 1 | Title slide: Gap Analysis |
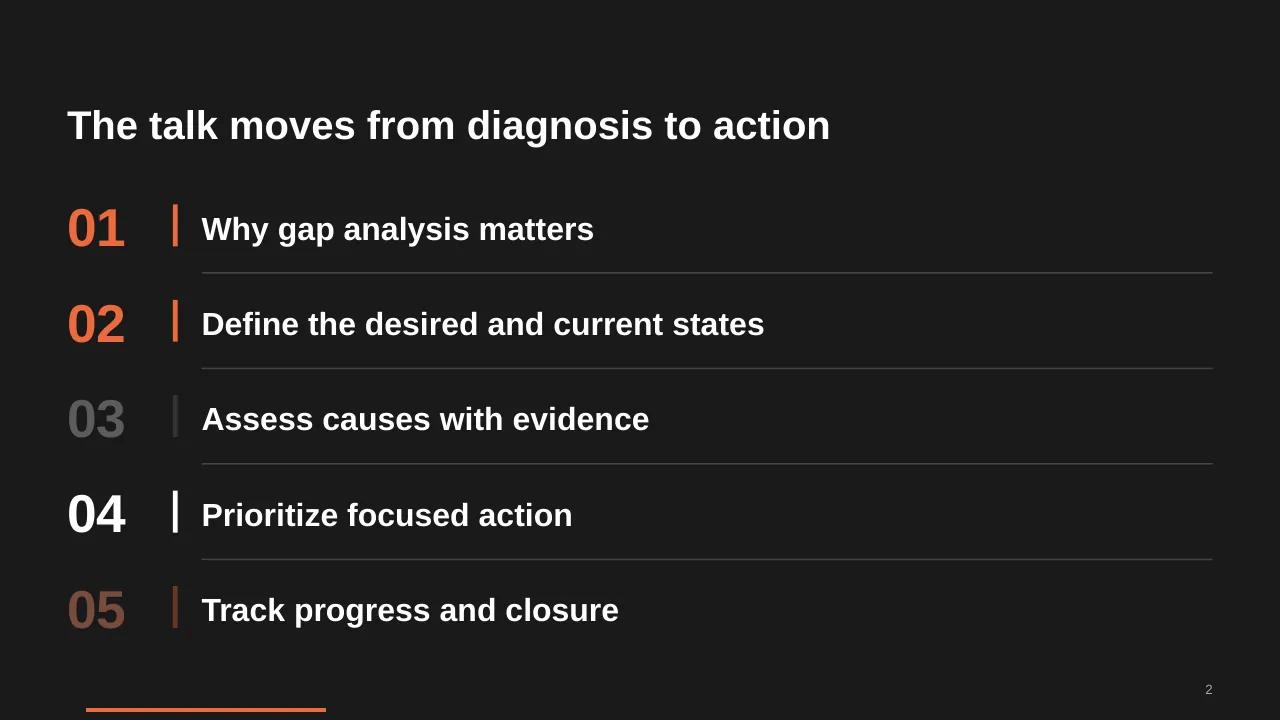
| 2 | The talk moves from diagnosis to action |
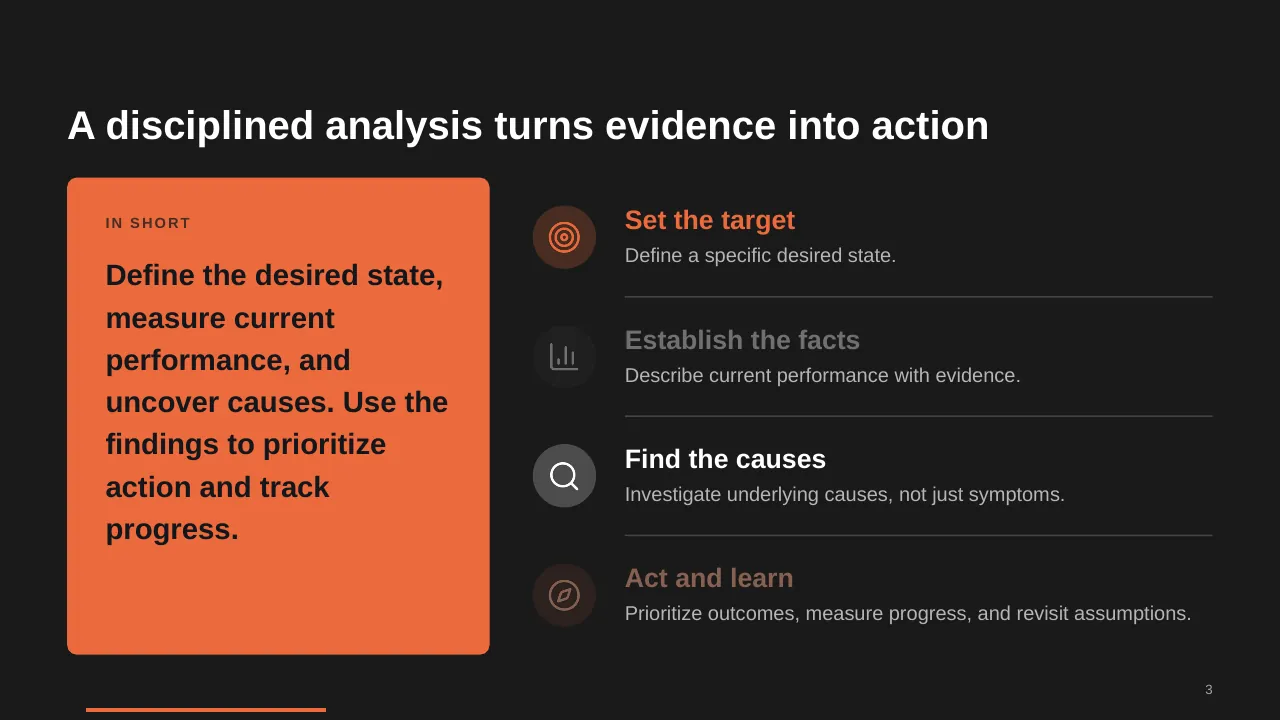
| 3 | Define the desired state, measure current performance, and uncover causes. Use the findings to prioritize… |
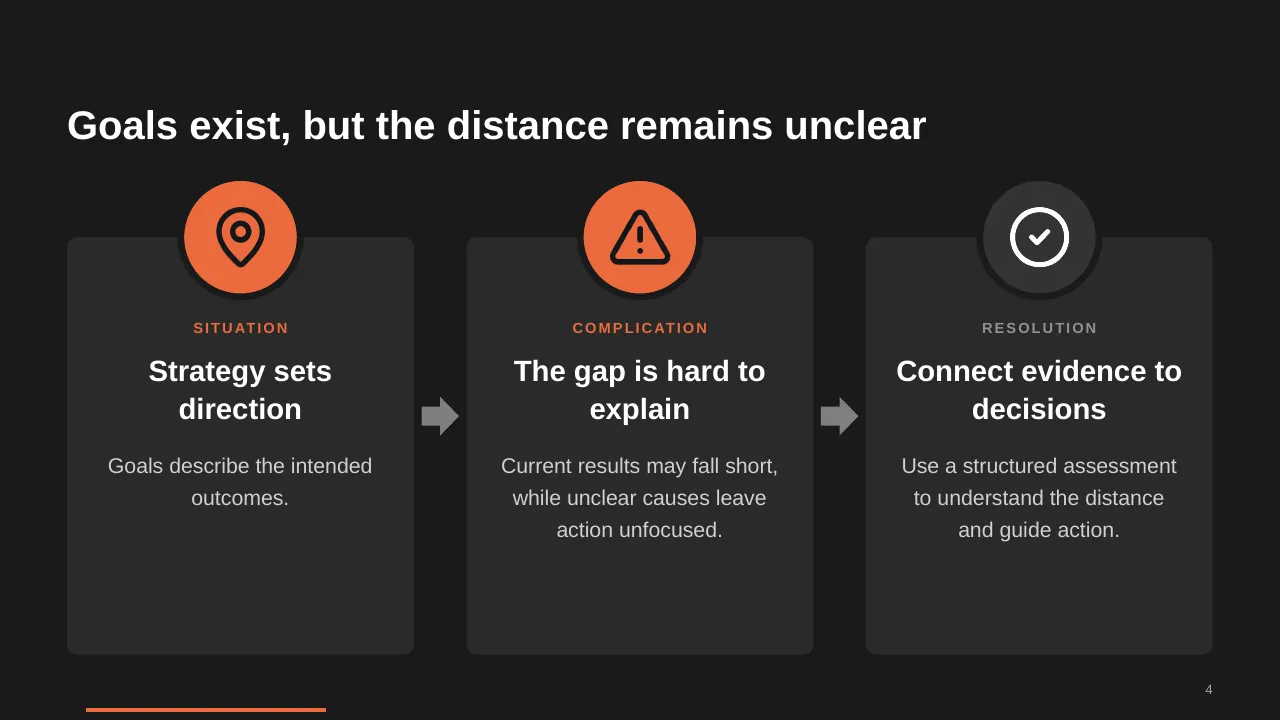
| 4 | Goals exist, but the distance remains unclear |
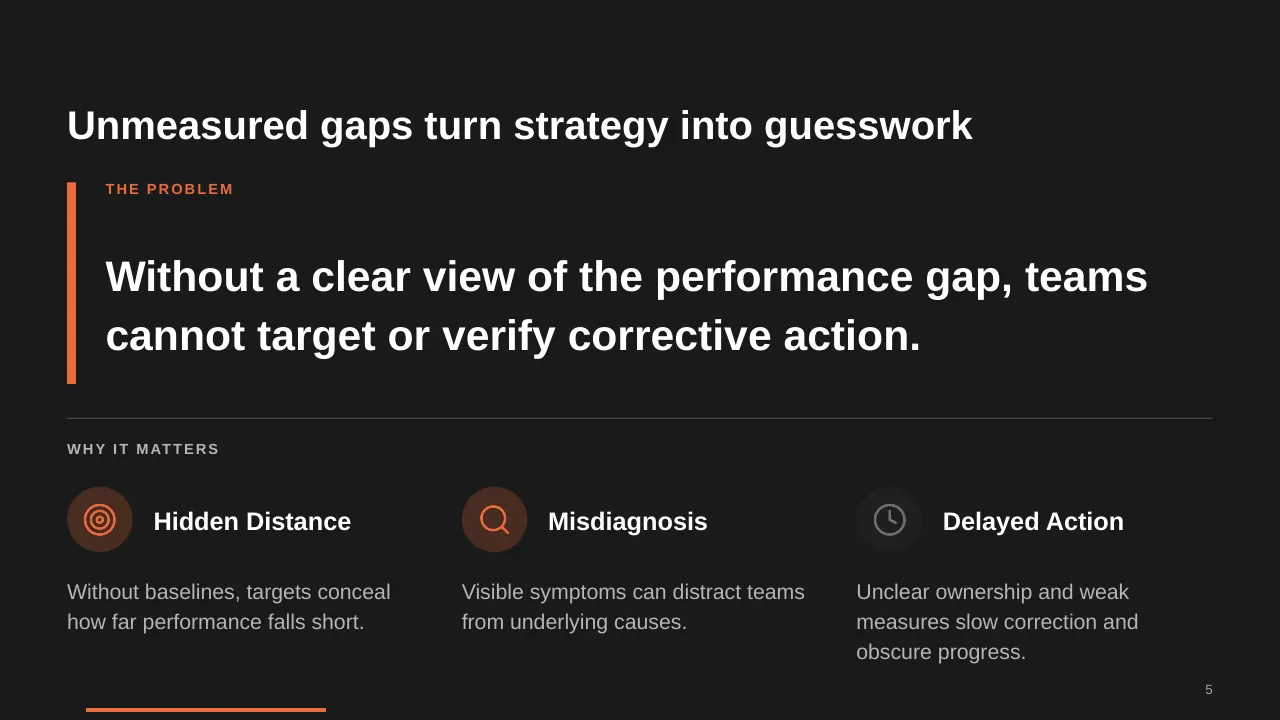
| 5 | Without a clear view of the performance gap, teams cannot target or verify corrective action. |
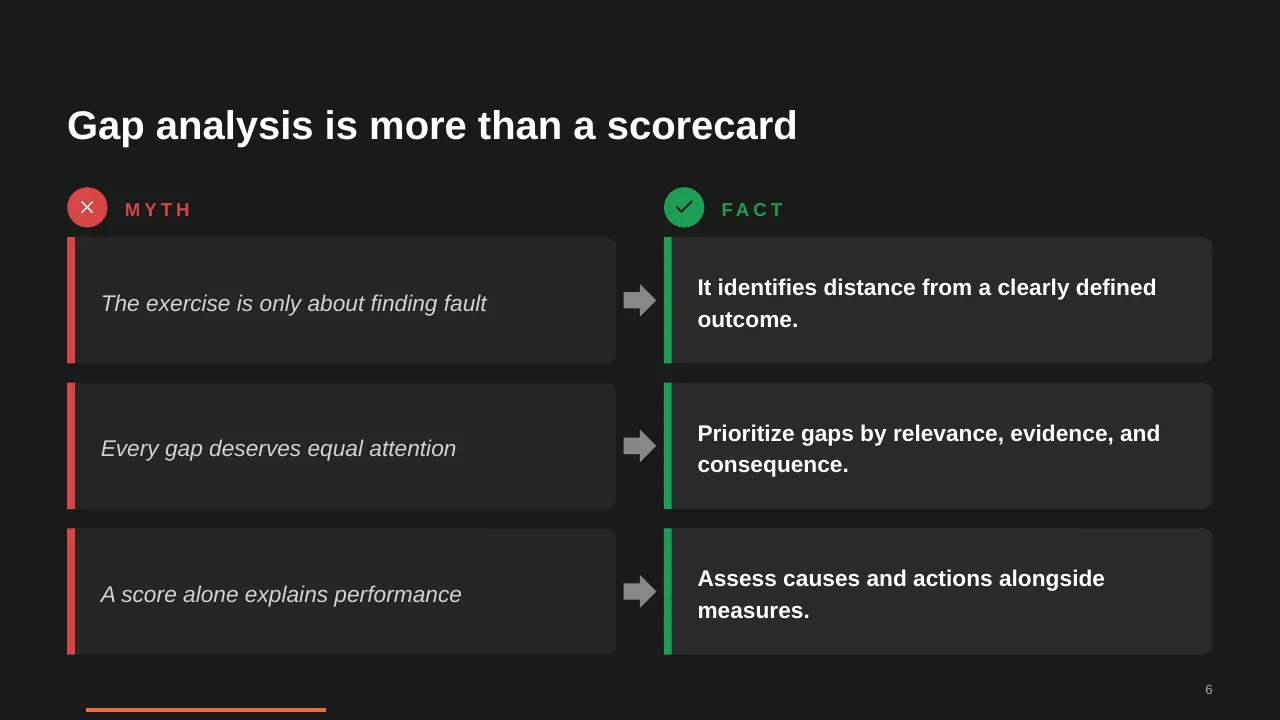
| 6 | Gap analysis is more than a scorecard |
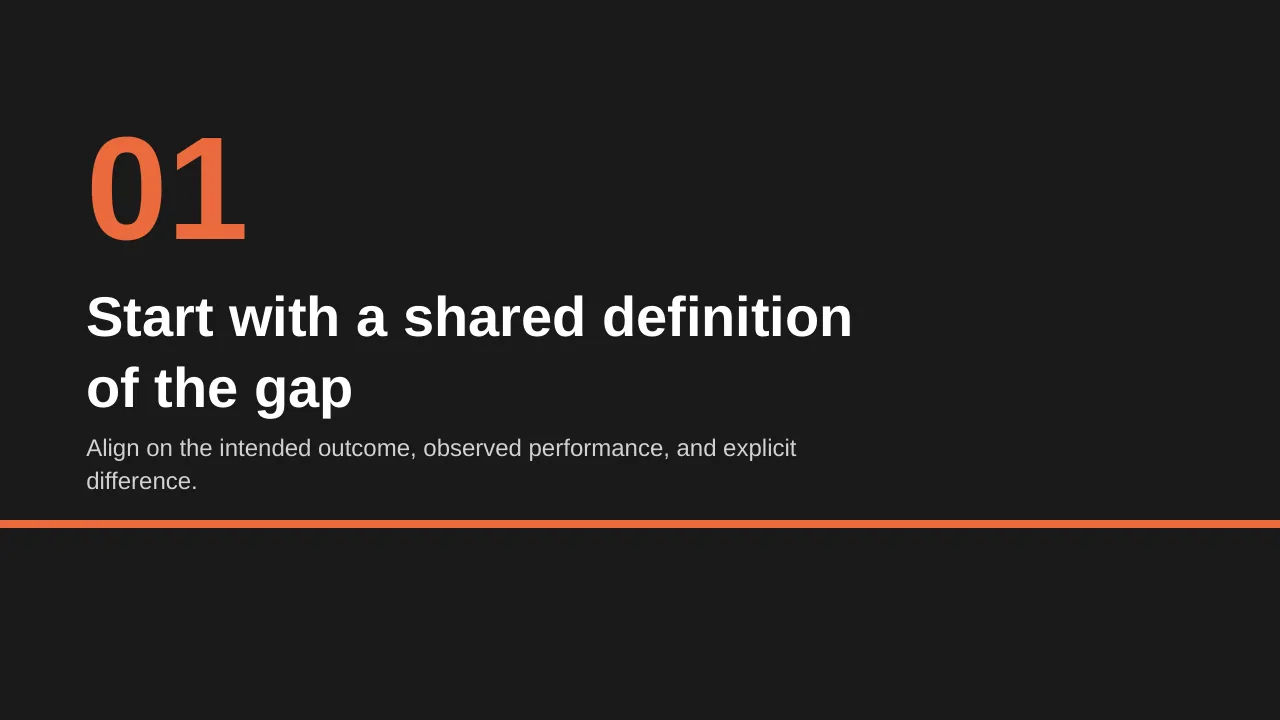
| 7 | Align on the intended outcome, observed performance, and explicit difference. |
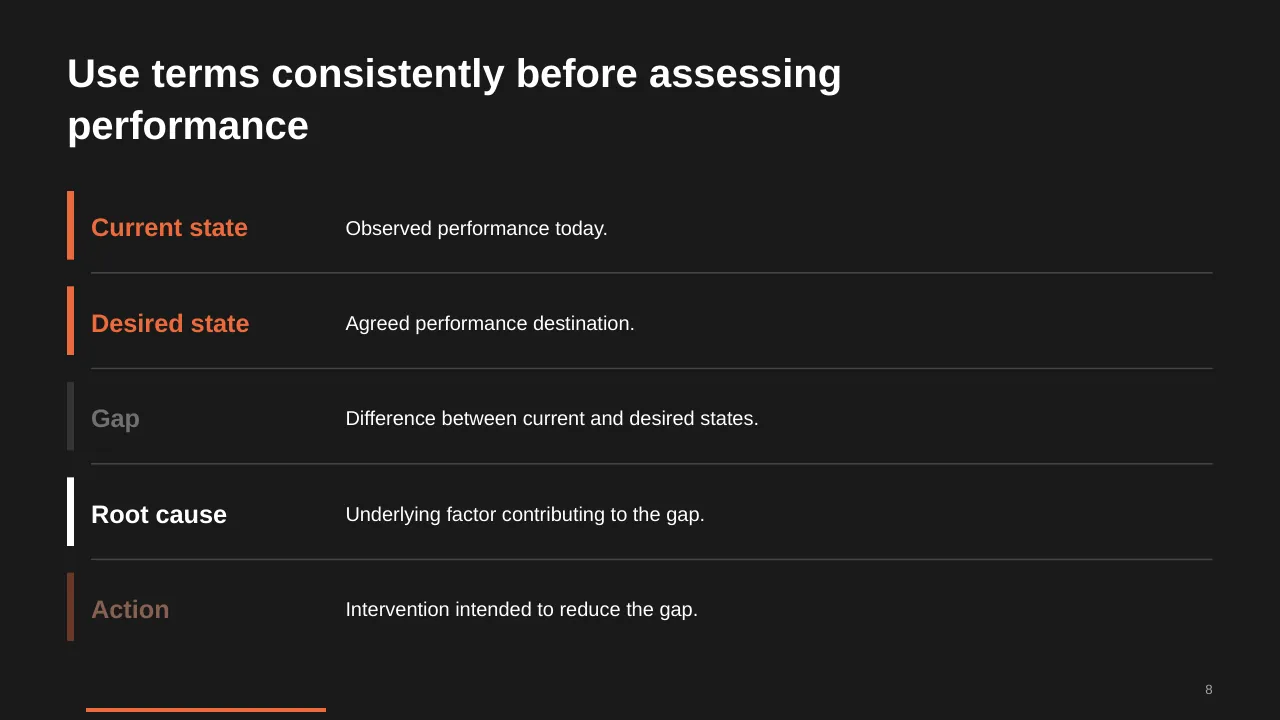
| 8 | Use terms consistently before assessing performance |
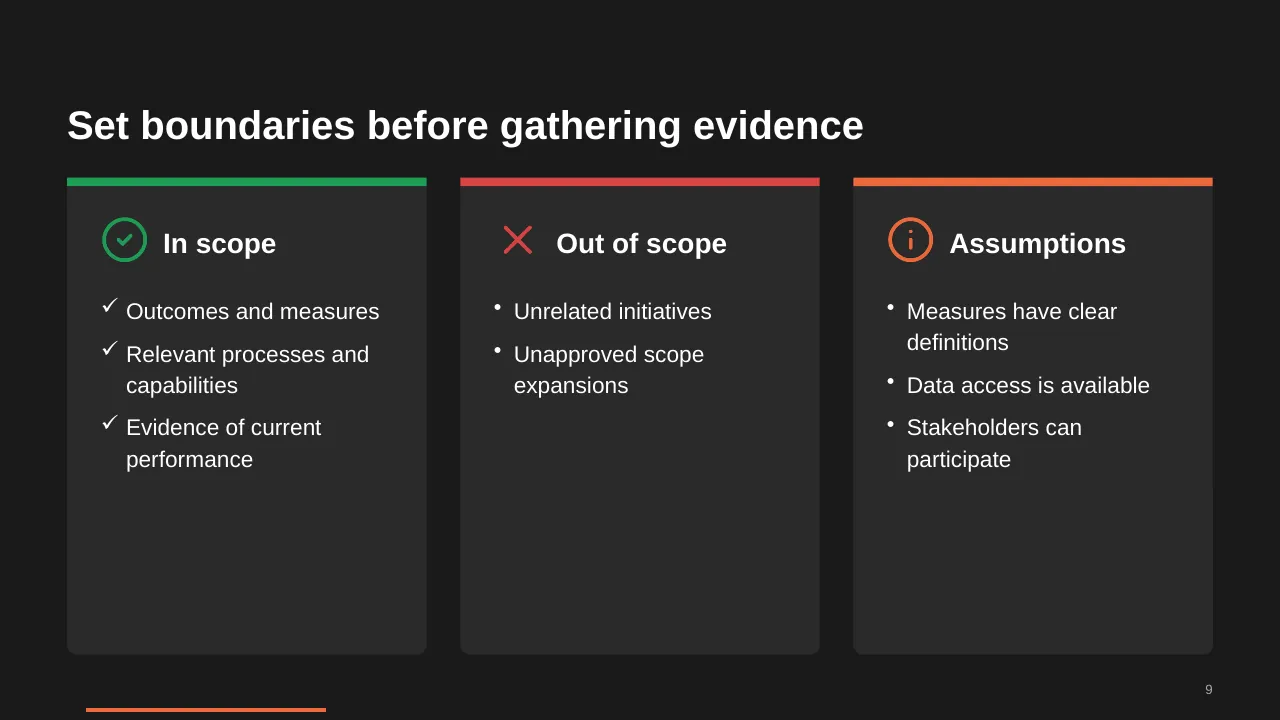
| 9 | Outcomes and measures Relevant processes and capabilities Evidence of current performance |
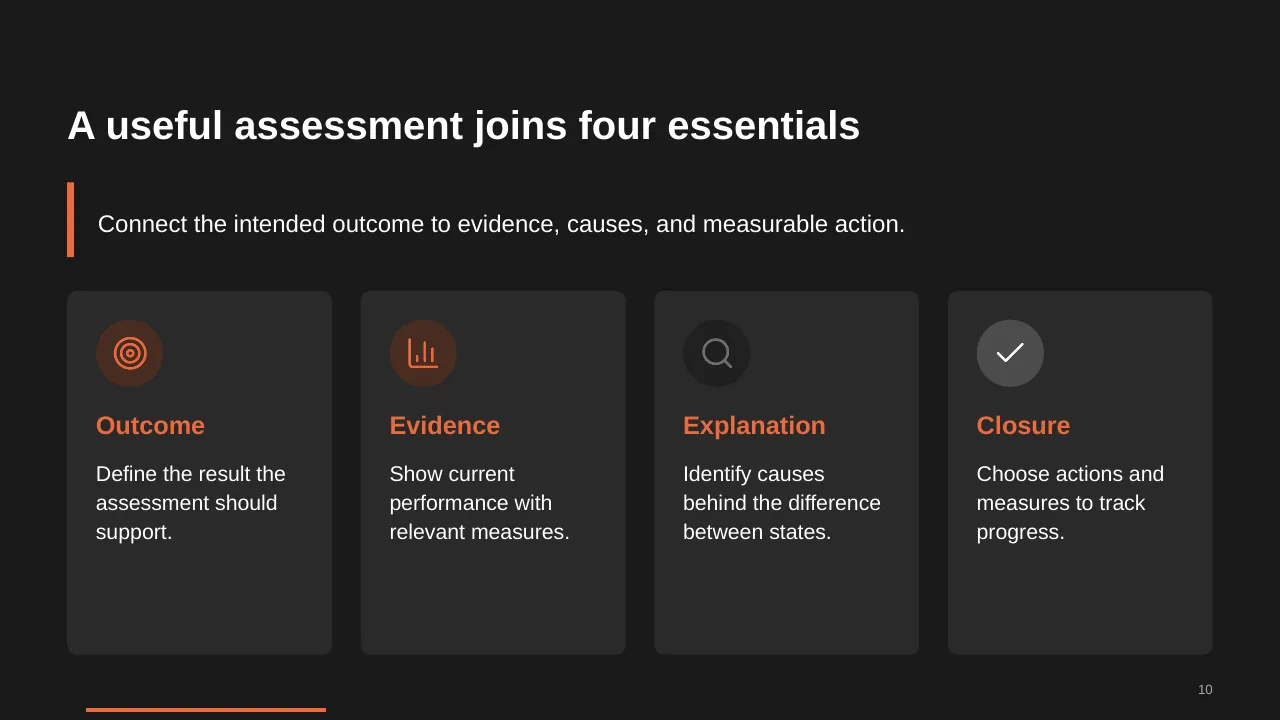
| 10 | Connect the intended outcome to evidence, causes, and measurable action. |
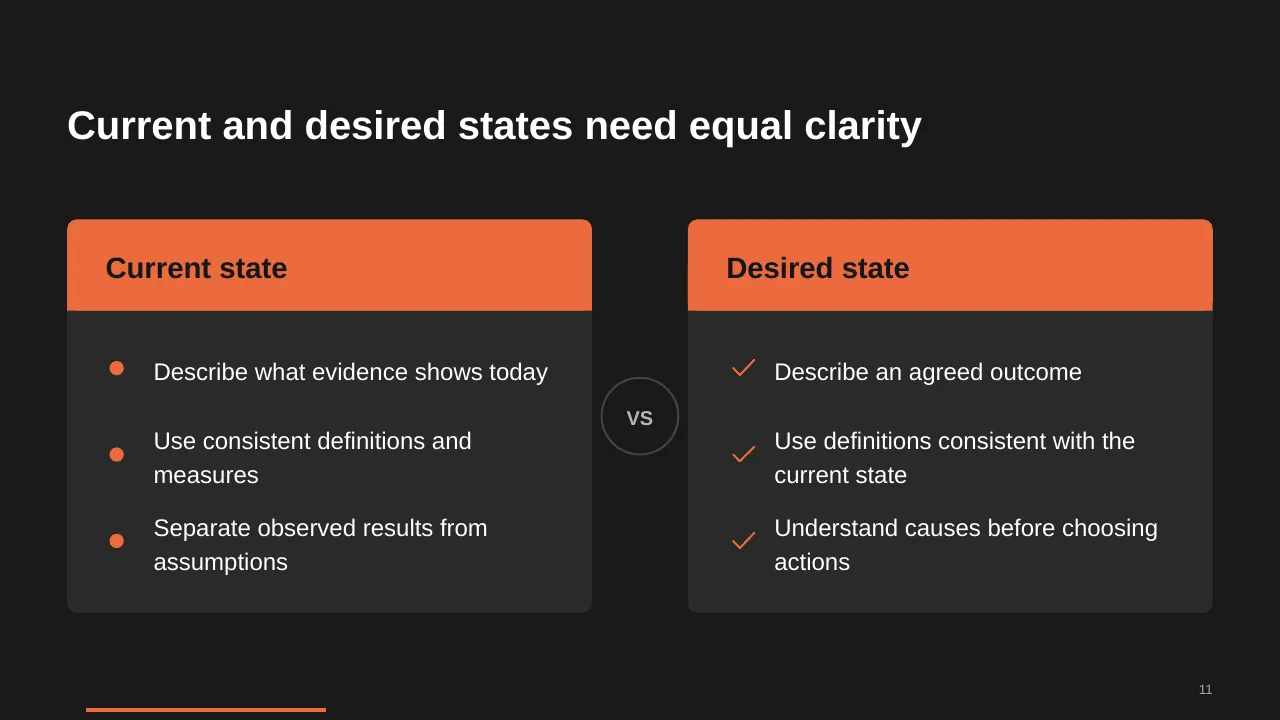
| 11 | Current and desired states need equal clarity |
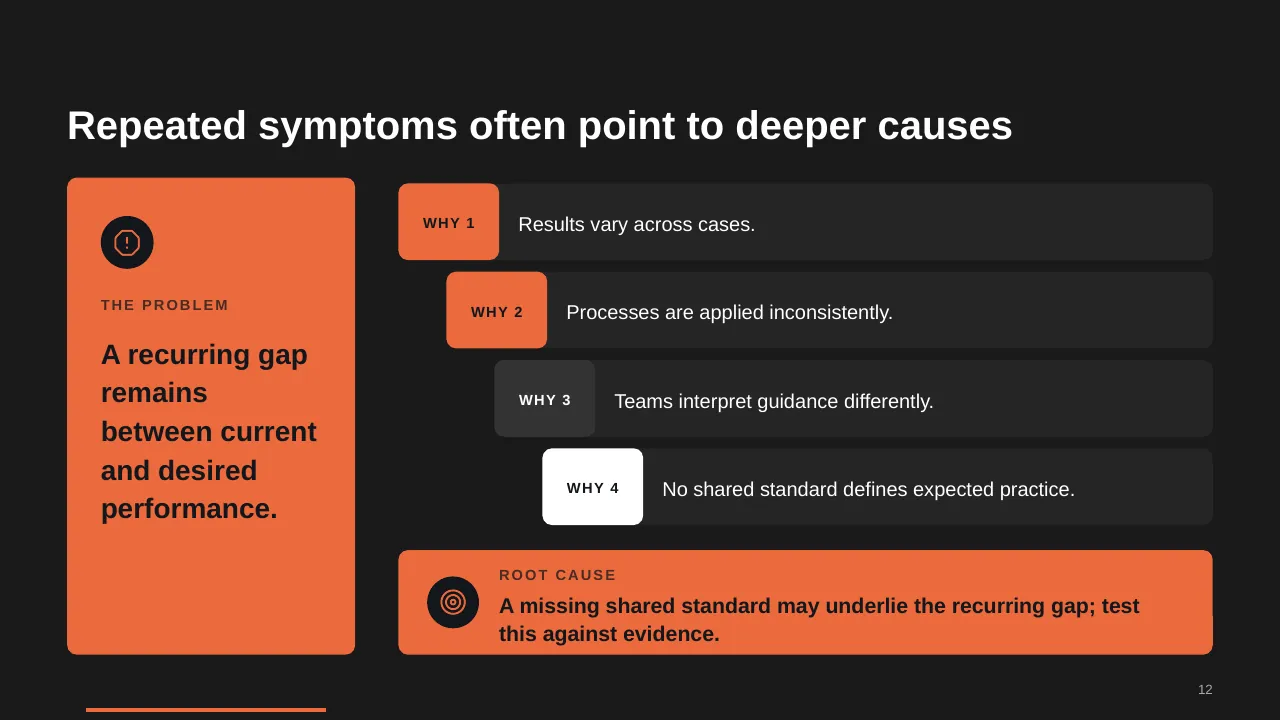
| 12 | A recurring gap remains between current and desired performance. |
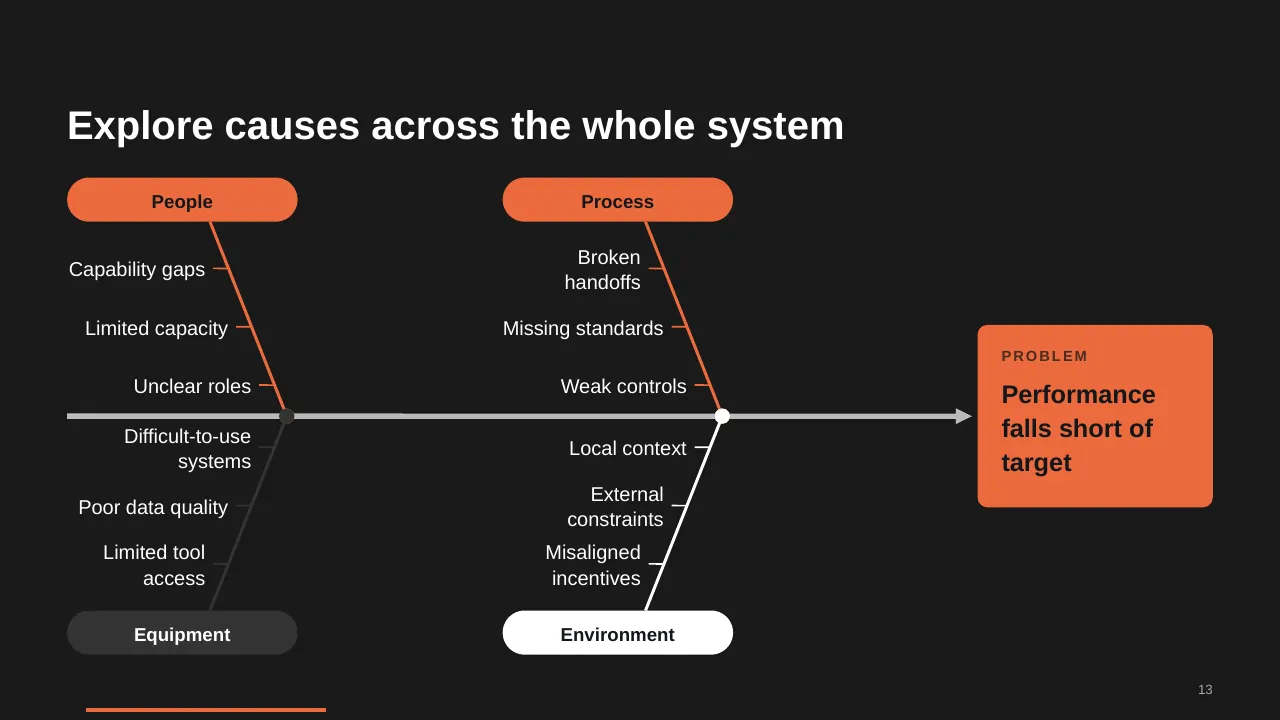
| 13 | Explore causes across the whole system |
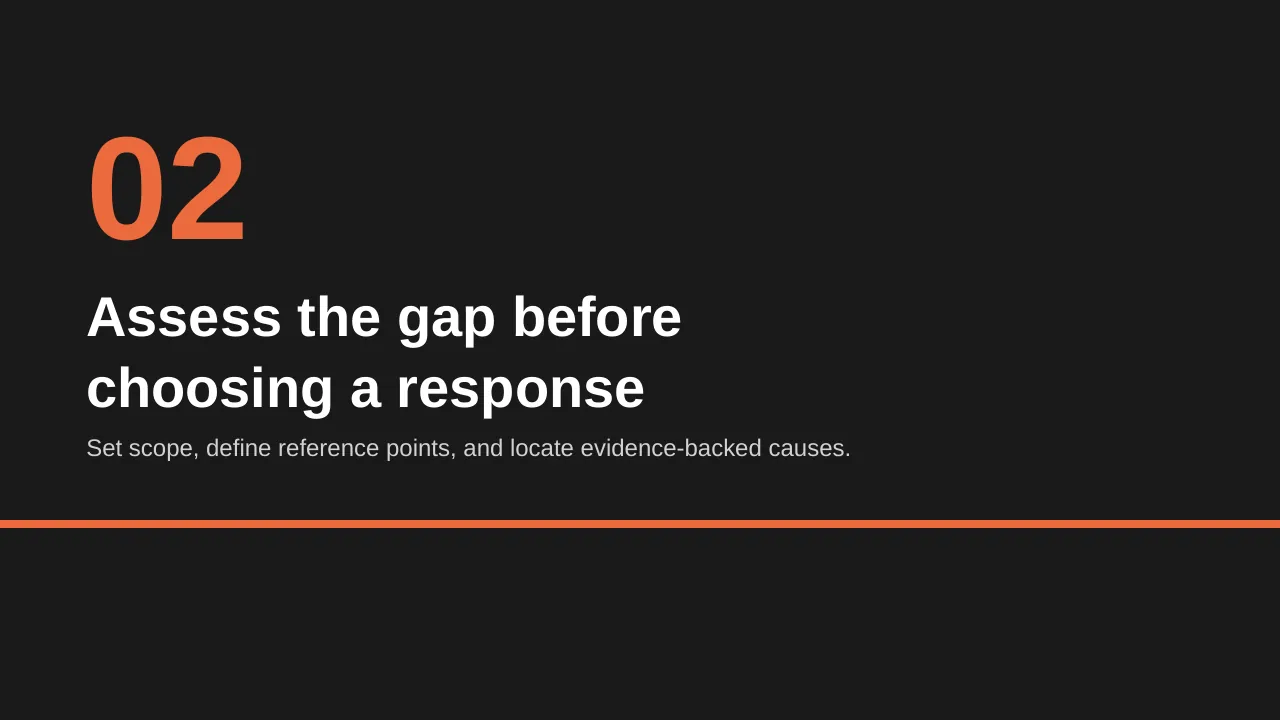
| 14 | Set scope, define reference points, and locate evidence-backed causes. |
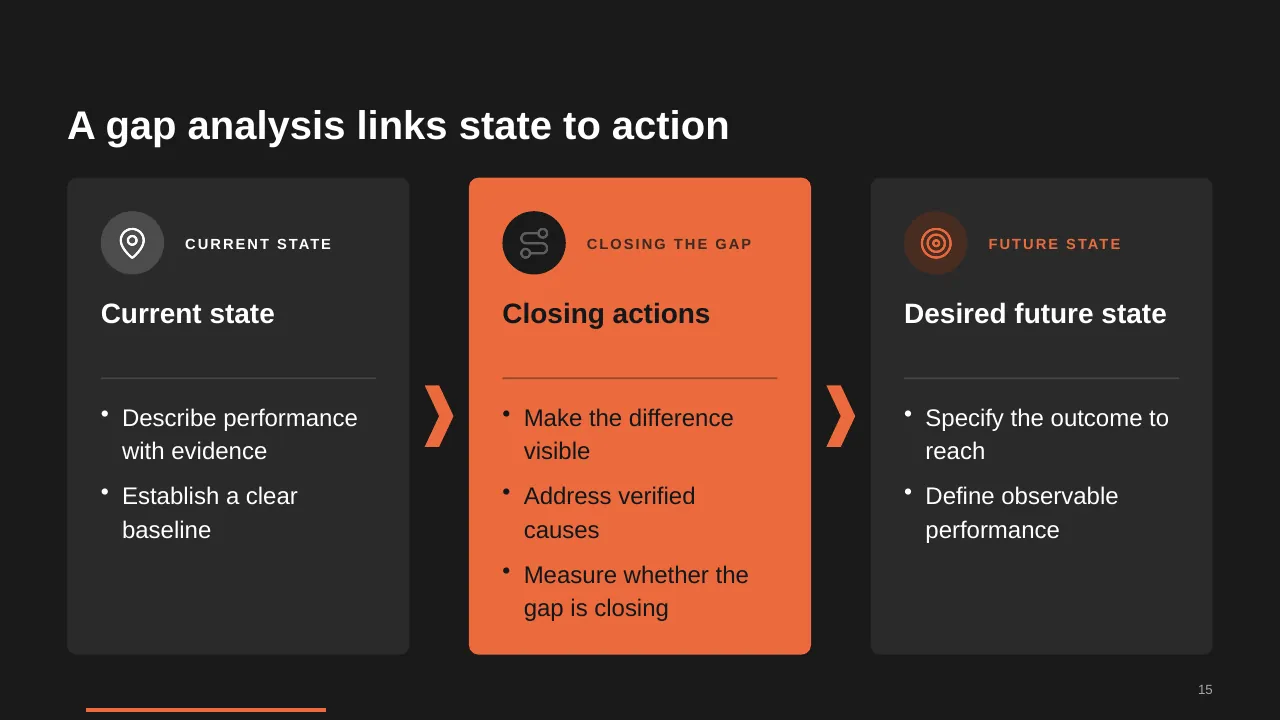
| 15 | A gap analysis links state to action |
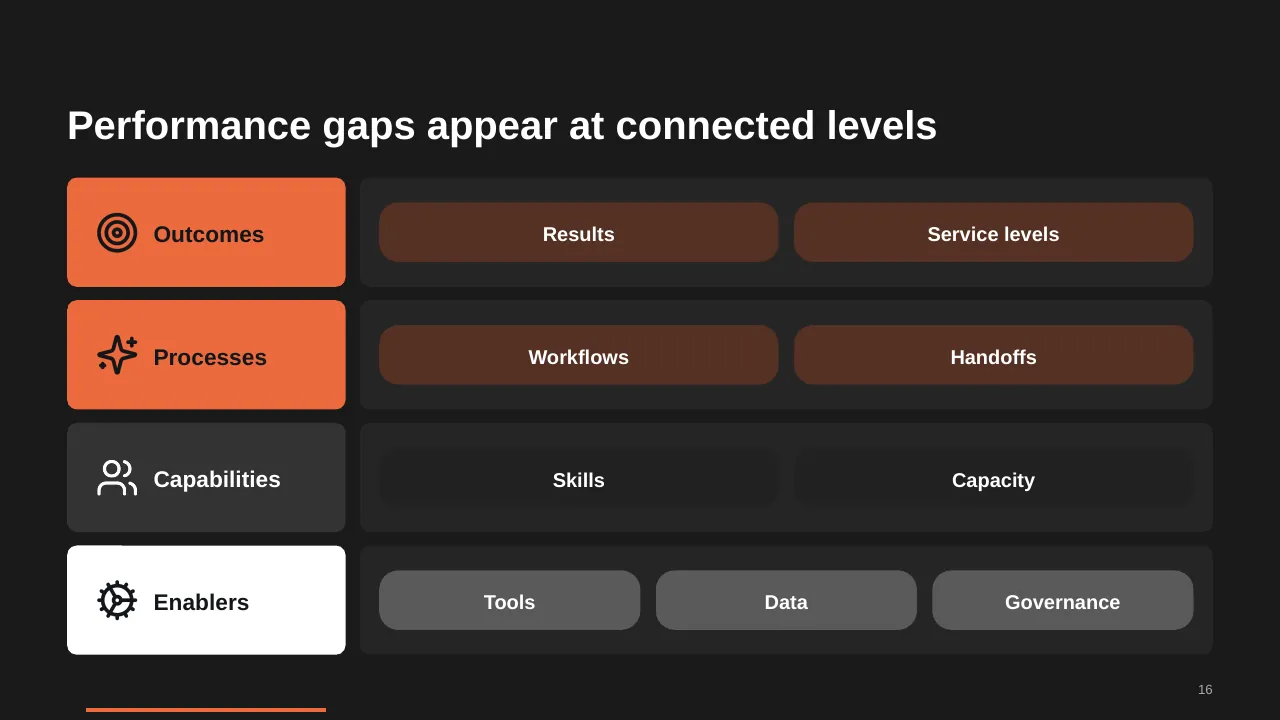
| 16 | Performance gaps appear at connected levels |
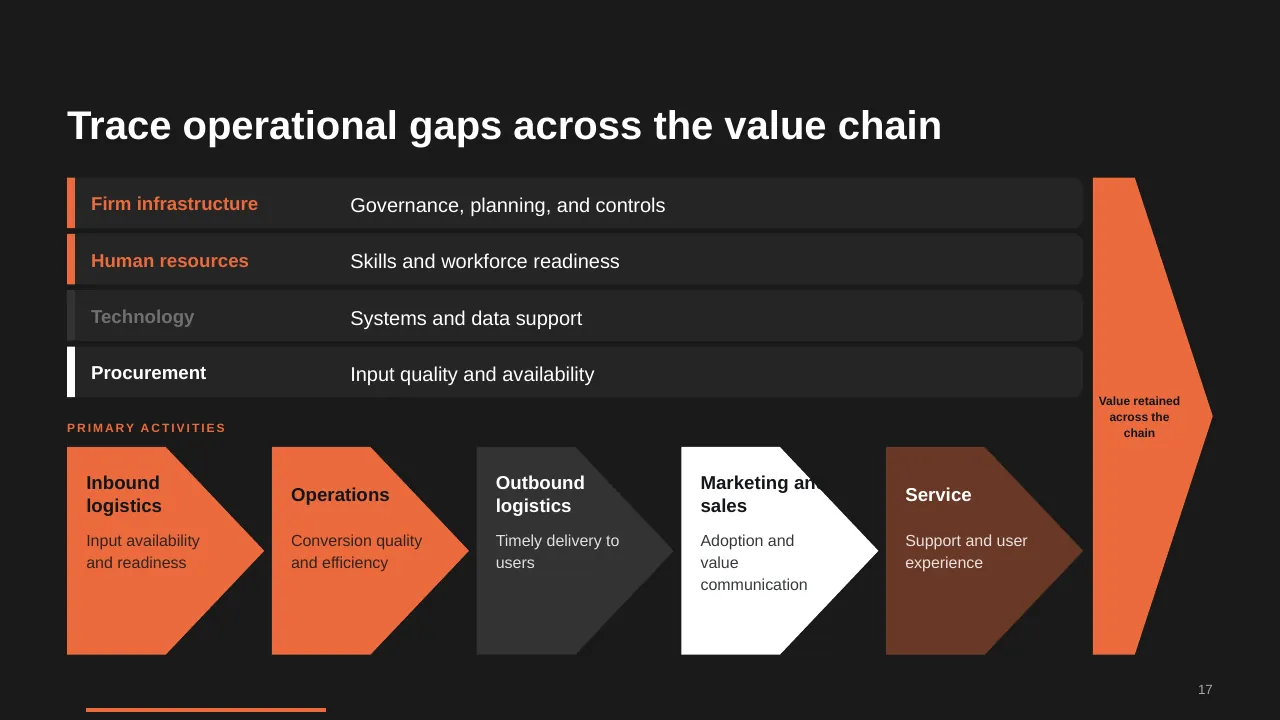
| 17 | Trace operational gaps across the value chain |
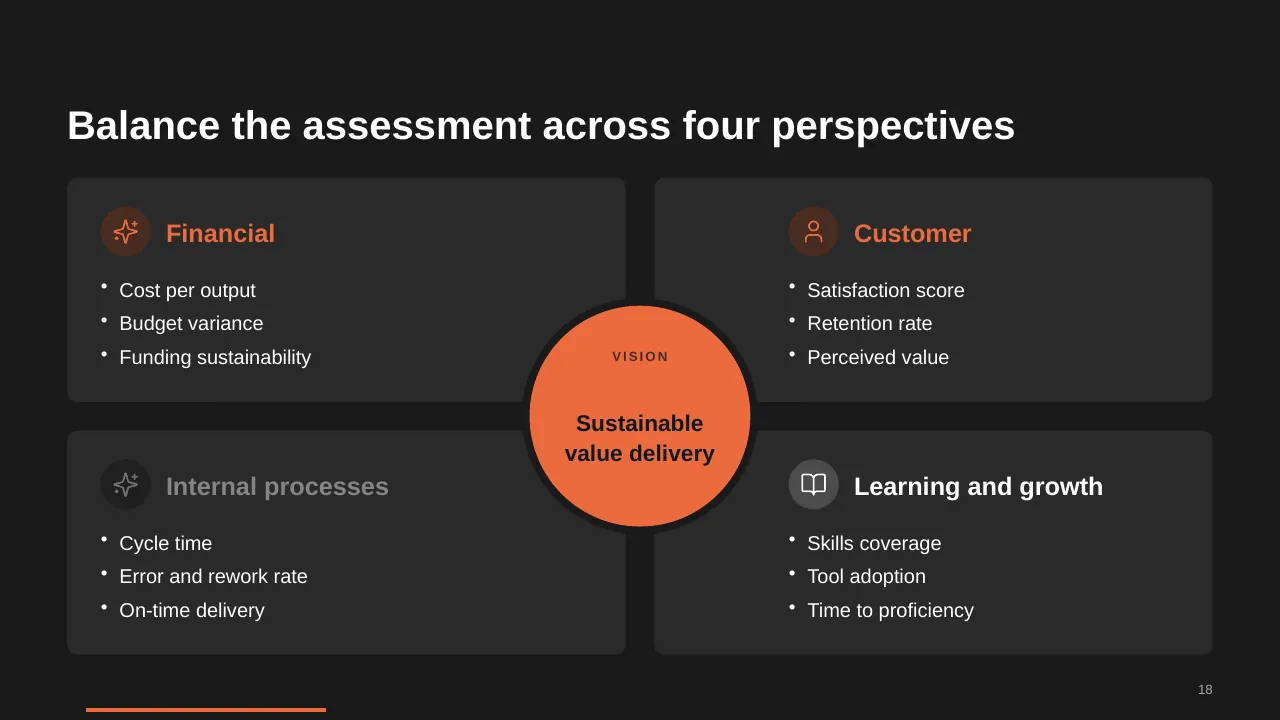
| 18 | Cost per output Budget variance Funding sustainability |
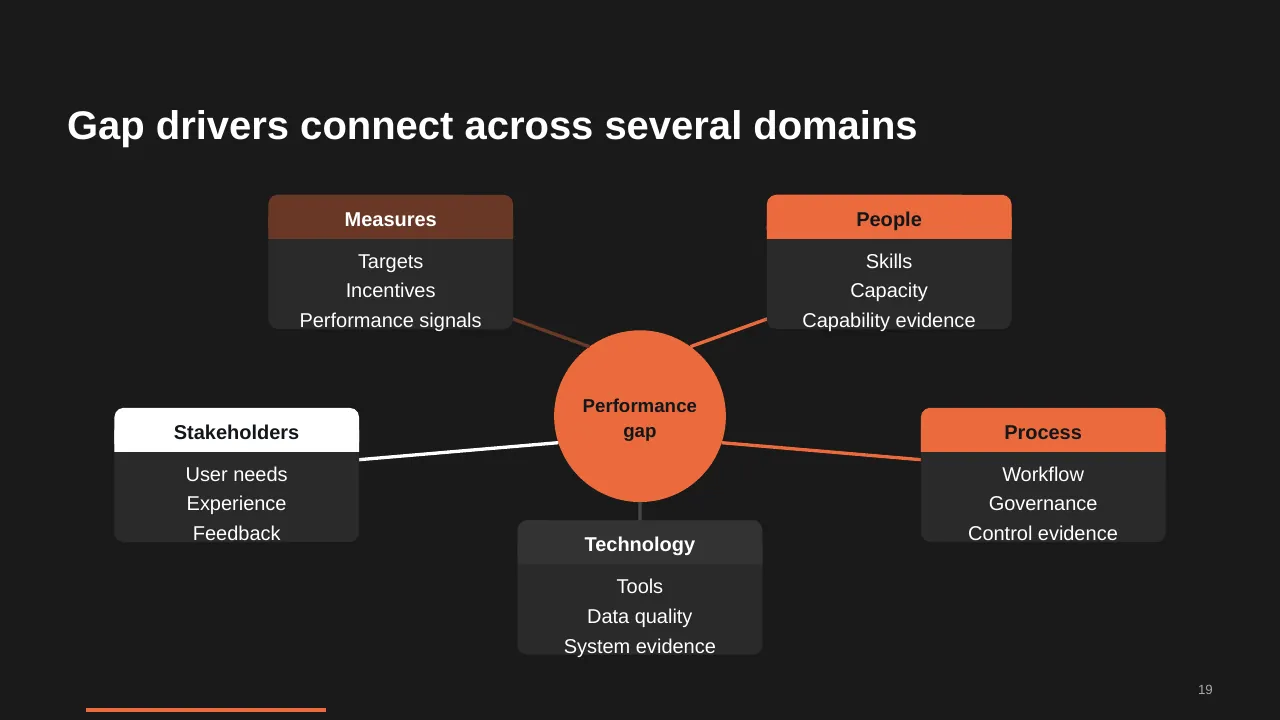
| 19 | Gap drivers connect across several domains |
| 20 | Address verified causes, match actions to the gap, and assign owners to review progress. |
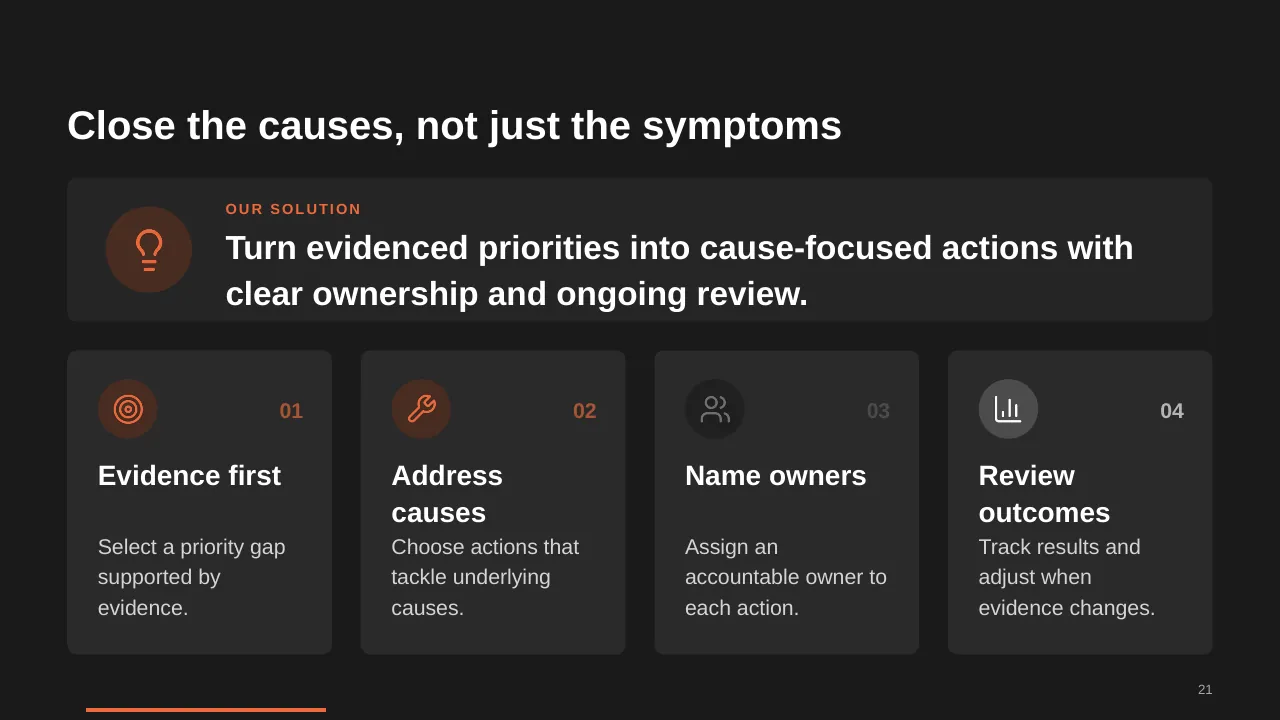
| 21 | Turn evidenced priorities into cause-focused actions with clear ownership and ongoing review. |
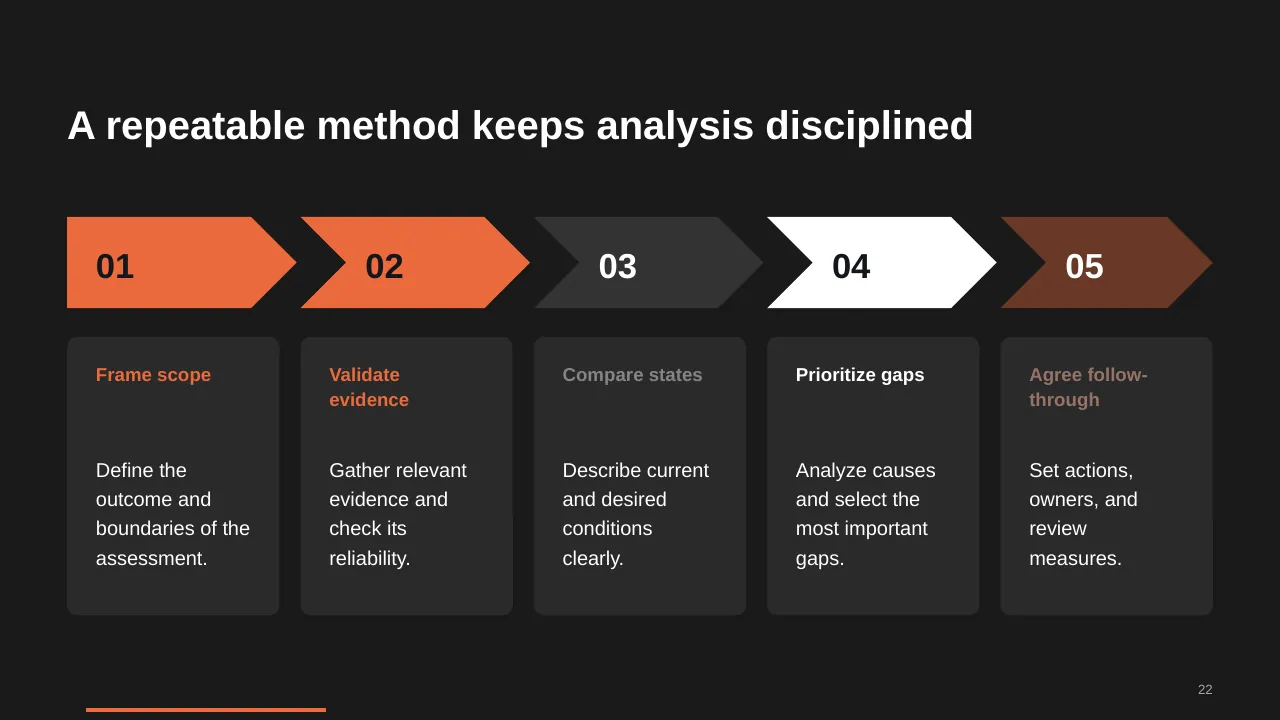
| 22 | A repeatable method keeps analysis disciplined |
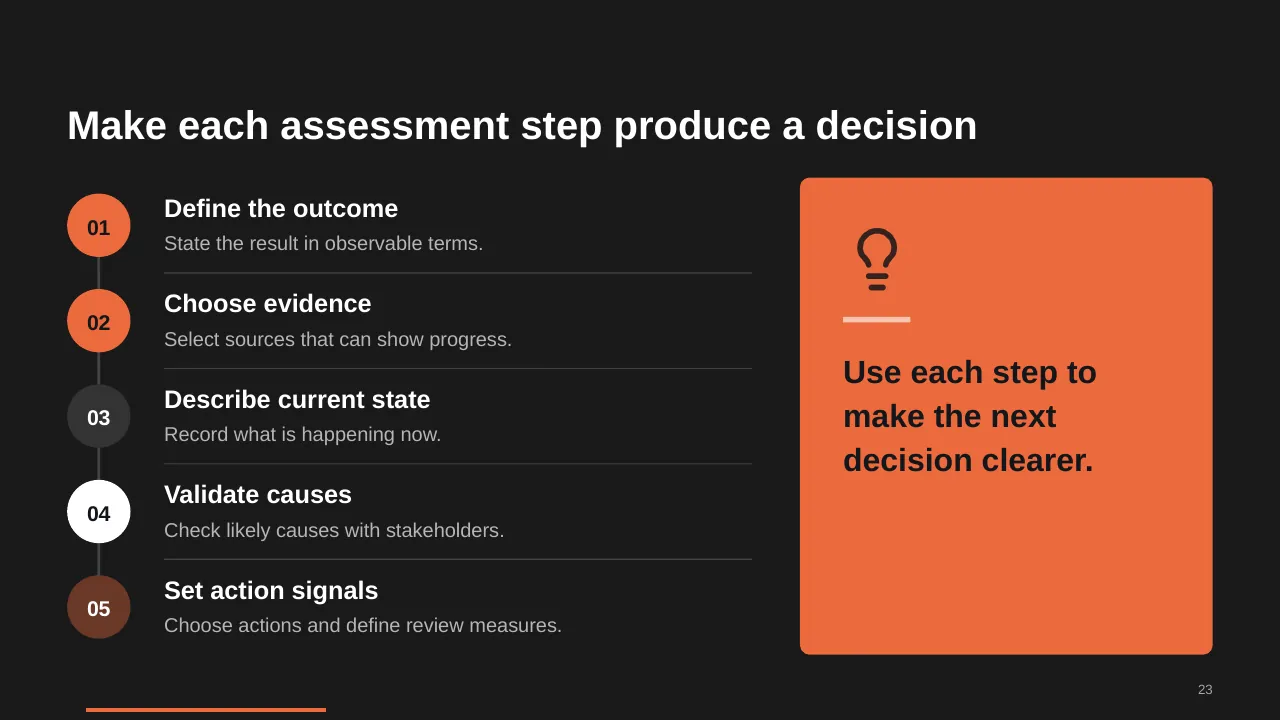
| 23 | Make each assessment step produce a decision |
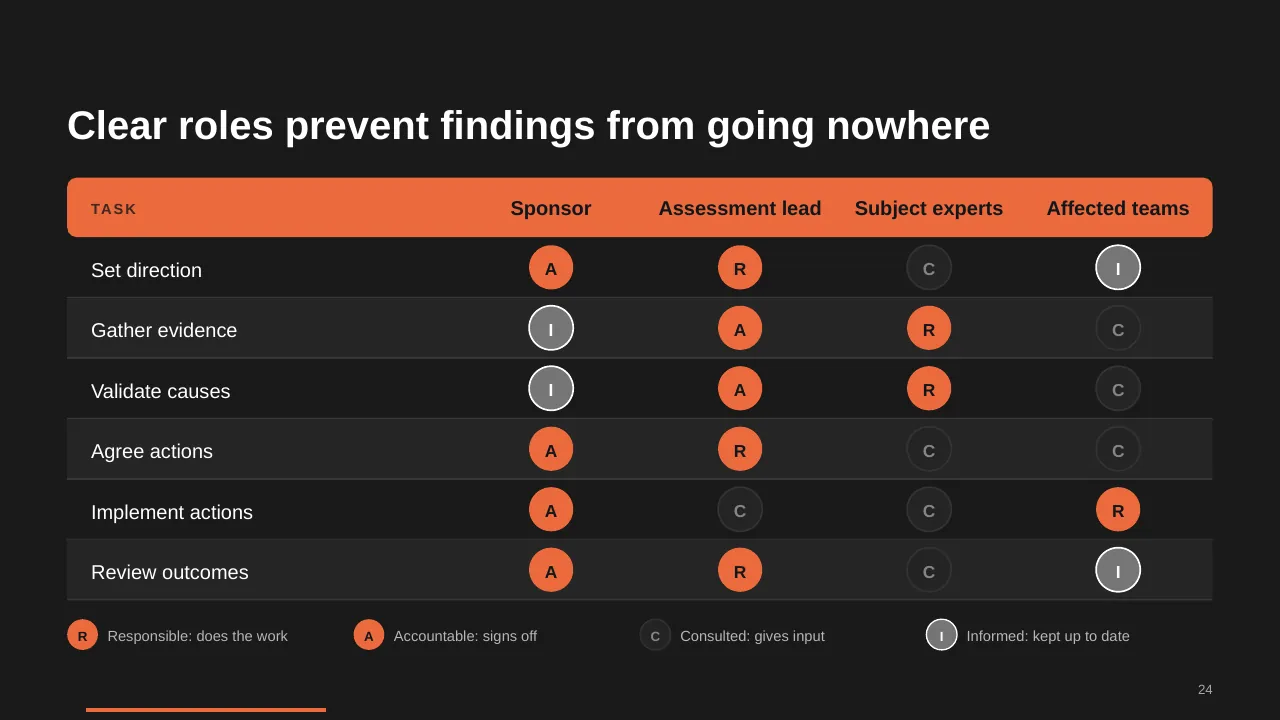
| 24 | Clear roles prevent findings from going nowhere |
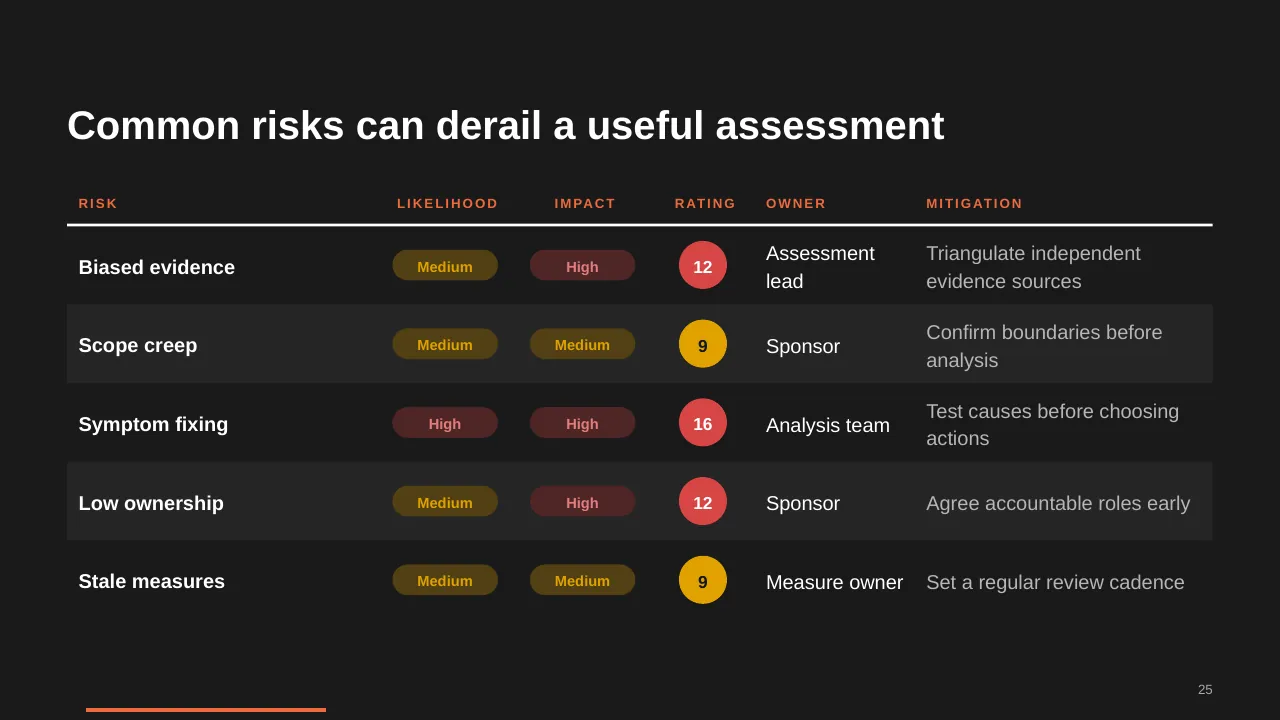
| 25 | Common risks can derail a useful assessment |
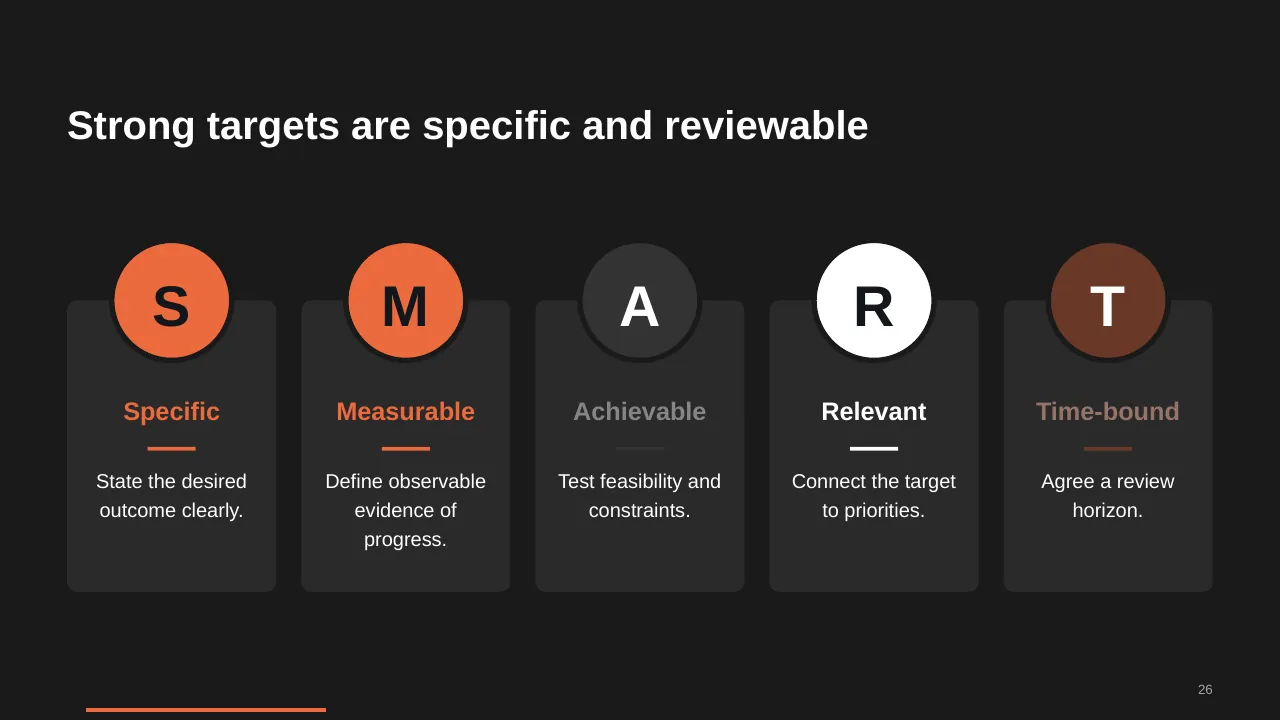
| 26 | Strong targets are specific and reviewable |
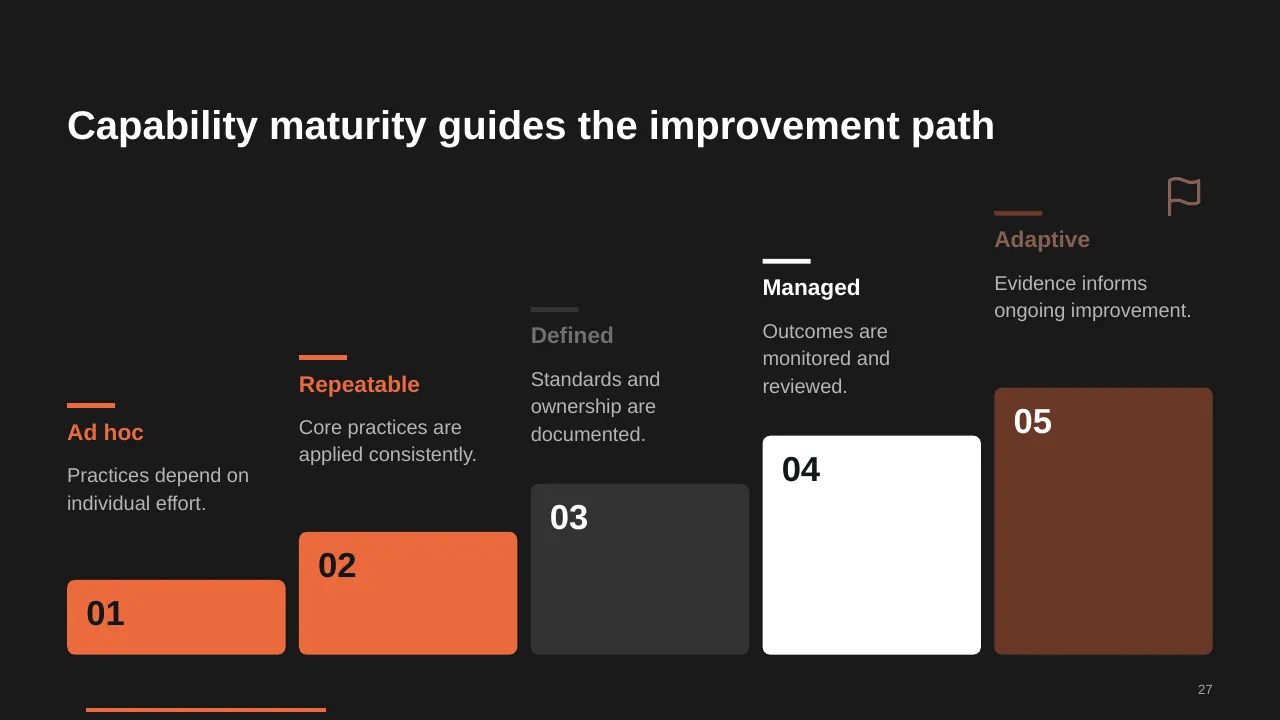
| 27 | Capability maturity guides the improvement path |
| 28 | Five tests keep priorities grounded |
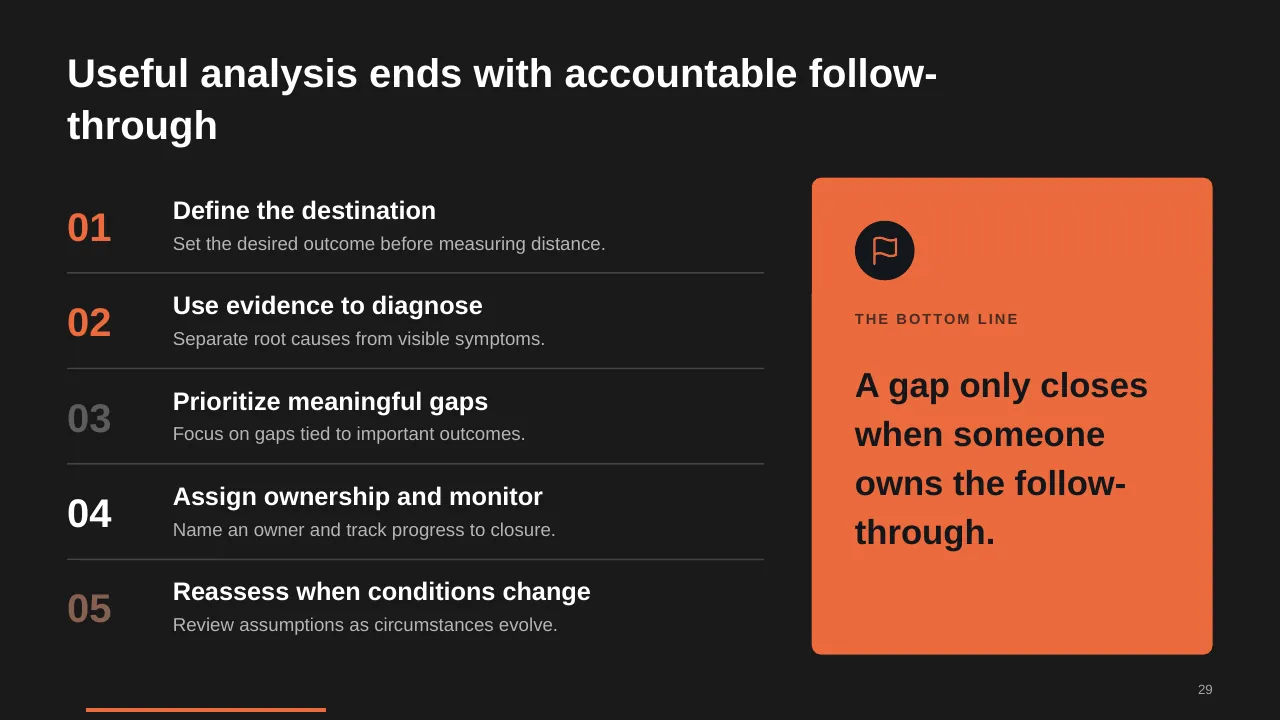
| 29 | Useful analysis ends with accountable follow-through |
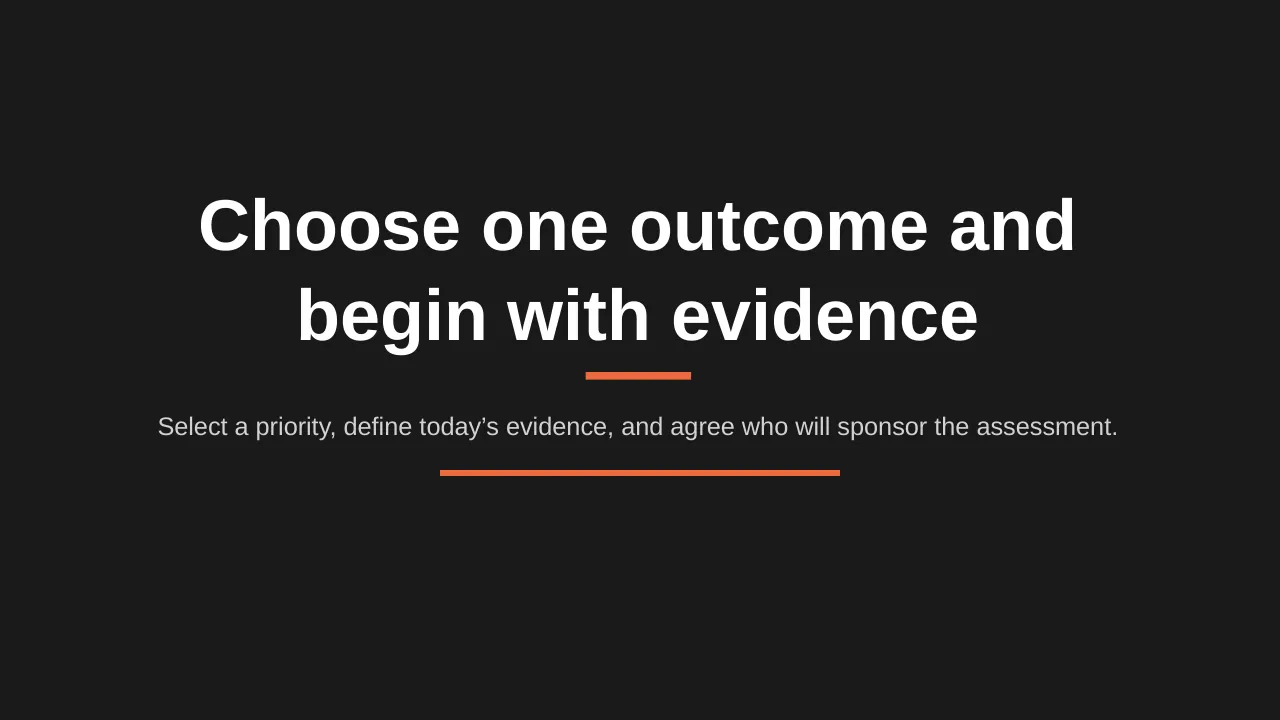
| 30 | Select a priority, define today’s evidence, and agree who will sponsor the assessment. |
Tips for a strategy presentation
- Limit yourself to three to five strategic priorities.
- Link each priority to projects; PMI found aligned projects succeed far more often.
- Show who owns each priority.
- Set a review rhythm so the plan is tracked, not filed.
Mistakes to avoid
- Too many priorities
- Strategy with no link to budgets or projects
- No owners or measures
Checklist before you present
- Is the current position clear?
- Are goals measurable?
- Are priorities few and clear?
- Does each have an owner?
- Are KPIs and review dates set?
Great for
- Board meetings and leadership offsites
- Annual and quarterly planning
- Executive summaries and business reviews
- New role and first-100-days plans
How to customise it
- Download the ZIP file and unzip it to get the .pptx presentation.
- Open it in PowerPoint, or upload it to Google Drive and open it with Google Slides.
- Replace the sample text and numbers with your own; charts update from their data sheets.
- Change the theme colours once to recolour the whole deck, then delete any slides you don't need.
Questions about a strategy presentation
What is the difference between a vision and a mission?
A vision describes the future you want to create; a mission describes what you do today and for whom.
How do I turn a strategy into an action plan?
Break each priority into initiatives, give each an owner, budget and milestones, and track them in a regular review.
Related presentations
- Quarterly Business Review PowerPoint Template
- Infinity Loop PowerPoint Presentation
- Company Vision and Mission PowerPoint Template
- Monthly Review PowerPoint Template
Browse all Business Strategy & Planning presentations or more strategy templates.
Template details
| Template | Gap Analysis PowerPoint Template |
|---|---|
| Categories | Strategy, Business Strategy & Planning |
| File format | PowerPoint (.pptx), delivered as a .zip file |
| Number of slides | 30 fully editable slides |
| File size | 2.4 MB |
| Slide size | 16:9 widescreen |
| Preview images | 30 |
| Editable | Yes: text, colours, shapes, icons and charts |
| Works with | PowerPoint 2010 and later, PowerPoint for Mac, Google Slides |
| Licence | Royalty-free, yours to keep using after your plan ends (terms of use apply) |
| Price | Included in every SlideVilla plan |
| Added | 22 Mar 2025 |
Questions about this template
Can I edit the Gap Analysis PowerPoint Template?
Yes. Every part of the Gap Analysis PowerPoint Template is made with native PowerPoint shapes and text boxes, so you can change the wording, colours, fonts and sizes, move or delete elements, and swap icons without losing quality.
Does the Gap Analysis PowerPoint Template work in Google Slides?
Yes. Download the .zip file, unzip it to get the .pptx, upload it to Google Drive and open it with Google Slides. The layout, shapes and text stay editable there too.
Is the Gap Analysis PowerPoint Template free?
It is a premium template, included in every SlideVilla plan together with the rest of the library. See plans and pricing.
What size and format is it?
It is a PPTX file in 16:9 widescreen format with 30 slides, 2.4 MB (downloaded as a .zip; unzip it to get the presentation), with 30 preview images shown above.
How to use this template
- Step 1DownloadClick Download, then unzip the .zip file to get the .pptx presentation.
- Step 2OpenOpen it in PowerPoint, or upload it to Google Slides from your Drive.
- Step 3Make it yoursChange text, colours, icons and charts. Every element is fully editable.
Categories
Tags
Related PowerPoint templates
More designs like this one, ready to edit.