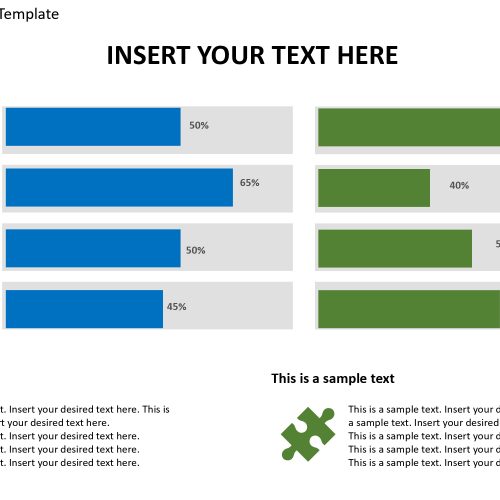
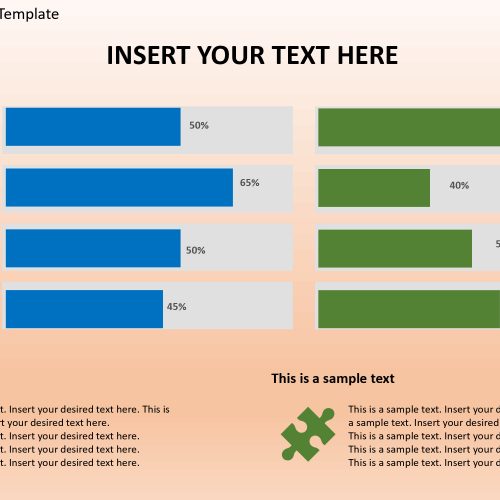
The 8-bar chart PowerPoint template is a business analysis deign used to show rate of growth, work, efficiency in a business strategy, company or process. The horizontal bars are placed side by side, and each bar has a percentage icon beside it, and these figures can be edited to the user’s choice.
The bars are colorful (blue and green), and the bar sizes can be edited to fit the desired taste of the user. This template is used in organizations where sales rate, department’s efficiency, marketing growth, and more need to be displayed in percentages. This template is easy to use and understand.
Features:
- Completely editable in terms of shape, color, size and text
- This template has a built in color theme which is unaffected by copy-pasting
- Includes an icon family with 135 unique completely editable icons
- Drag and drop image placeholder
- Completely editable (using spreadsheet) data-driven charts for displaying statistics
- Completely editable vector graphics
Supports
Microsoft PowerPoint 2010, 2011, 2013, 2016
MacOffice 2016, MacOffice 365


Be the first to review “8 Bar Chart for PowerPoint Template”