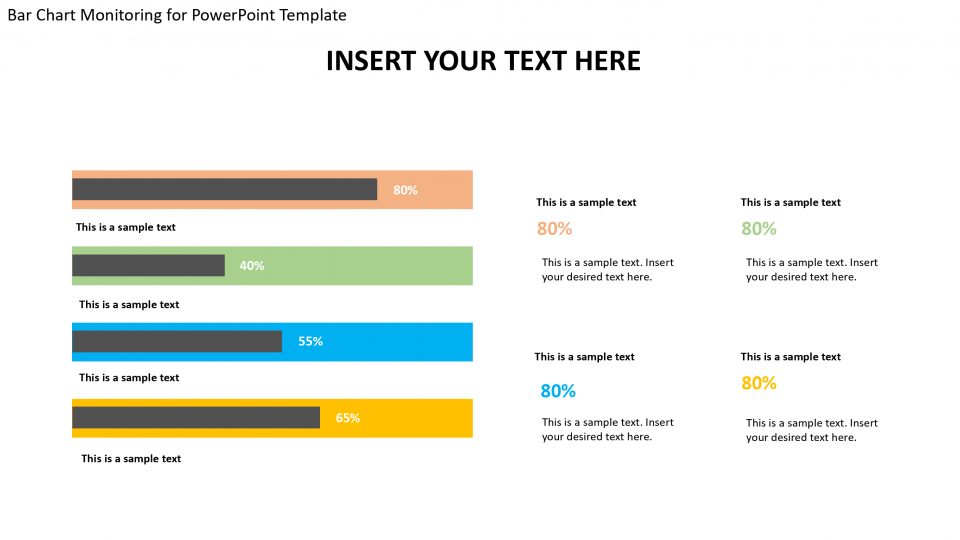
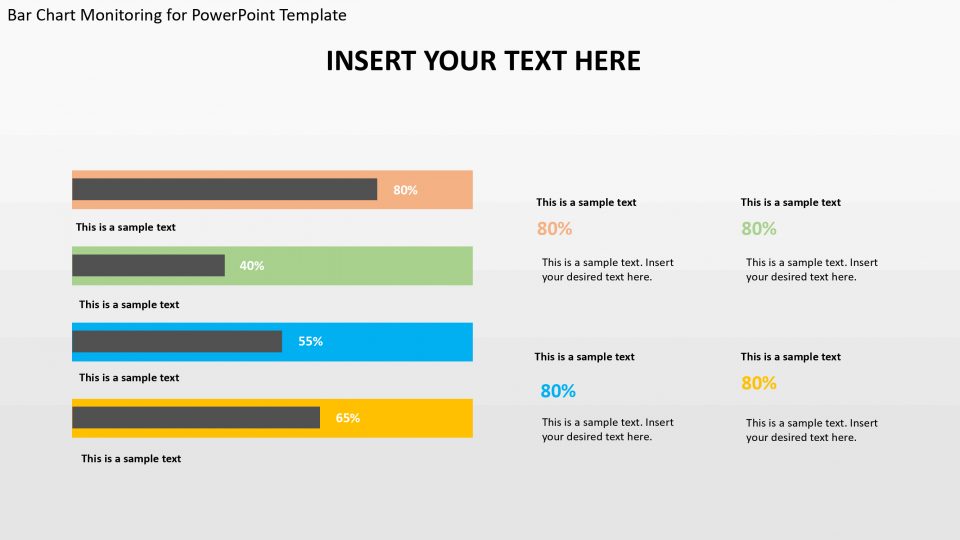
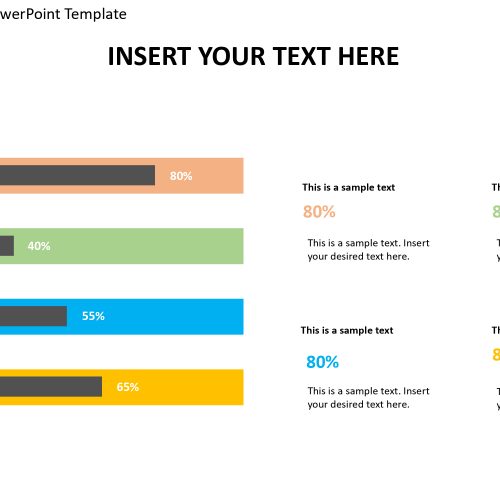
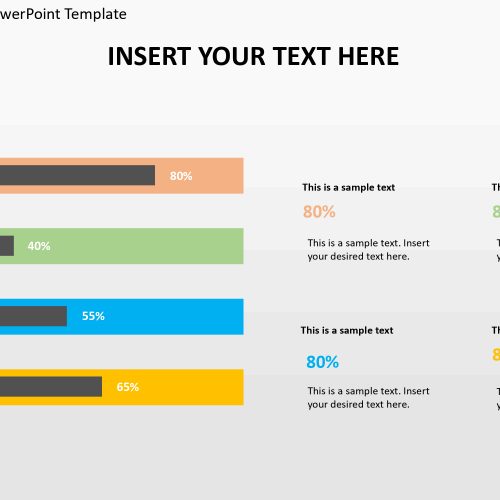
The bar chart monitoring powerpoint template is used in corporate organization to rate and monitor the growth rate, sales rate or the efficiency of the sectors in the organization. This template is east to use as well as editable.
In every business, there has to be performance reviews in able to understand what areas need to be worked on immediately, and what areas need to be left the way they are. These factors cannot be understood by the audience during a presentation if they are not well structured in a bar chart and stating the percentage level of each.
Features:
- Completely editable in terms of shape, color, size and text
- This template has a built in color theme which is unaffected by copy-pasting
- Includes an icon family with 135 unique completely editable icons
- Drag and drop image placeholder
- Completely editable (using spreadsheet) data-driven charts for displaying statistics
- Completely editable vector graphics
Supports
Microsoft PowerPoint 2010, 2011, 2013, 2016
MacOffice 2016, MacOffice 365


Be the first to review “Bar Chart Monitoring for PowerPoint Template”