
**Visualizing Data with Iceberg Graphics PowerPoint Presentation**
Unlock the potential of your data presentations with the Visualizing Data with Iceberg Graphics PowerPoint Presentation. This innovative and visually engaging template is designed to help professionals across all industries depict complex data in a clear and compelling manner. Whether you’re a business analyst, educator, marketer, or consultant, this toolkit is tailored to enhance the way you present your data insights and analysis.
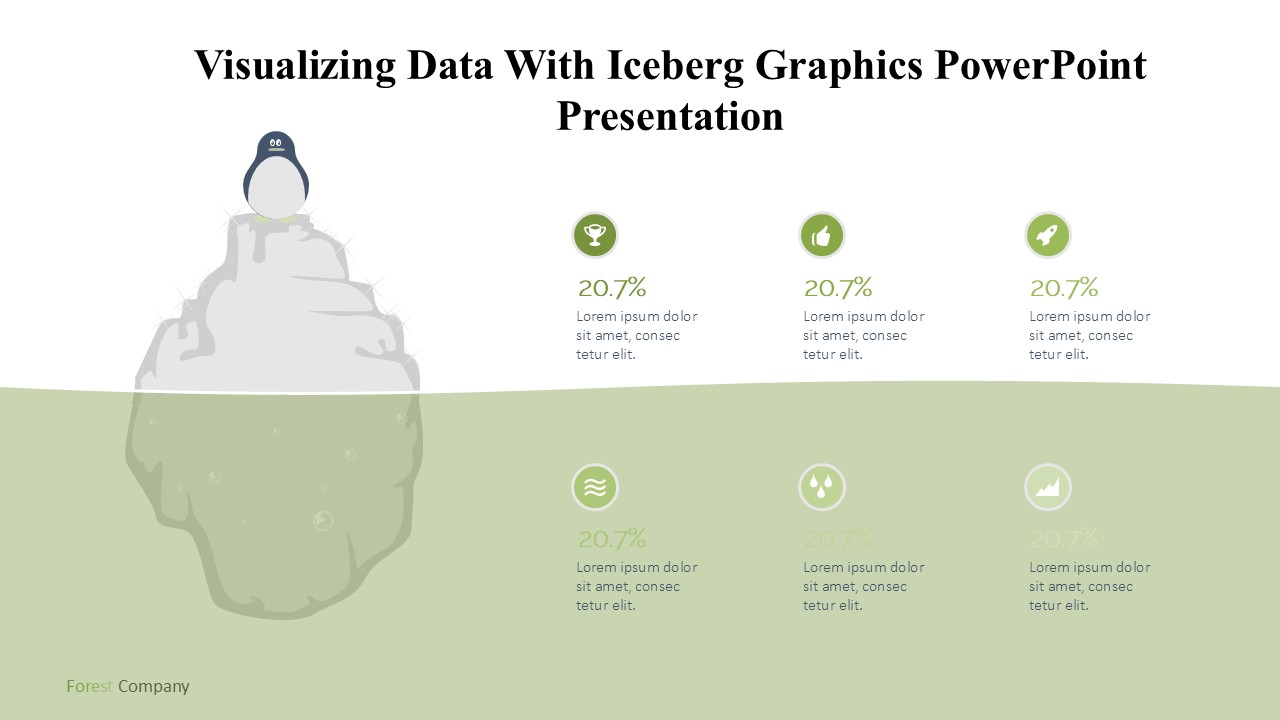
The Visualizing Data with Iceberg Graphics PowerPoint Presentation is not just a set of slides; it’s a comprehensive solution for storytelling with data. The iceberg graphic is a powerful metaphor often used to illustrate the known versus unknown, surface data versus underlying trends, or simple insights against complex backgrounds. With this presentation template, you can leverage this metaphor to structure your information, making your data not only accessible but also memorable.
This presentation package contains a variety of layouts and designs, each fully customizable to suit your specific needs. The main feature is the iceberg illustration, which is creatively used throughout the slides to showcase quantitative and qualitative data. The top of the iceberg can highlight key points, figures, or summaries, while the submerged part can be used to present deeper insights, supporting data, or analysis. This visual arrangement helps in guiding the audience through a logical flow from a high-level overview to in-depth analysis effortlessly.
**Features:**
**1. Fully Editable Templates:** Every slide and element within the Visualizing Data with Iceberg Graphics PowerPoint Presentation is fully editable. This means you can easily change colors, text, fonts, and even the size of graphics without losing quality. Tailor each slide to fit your branding or specific presentation requirements seamlessly.
**2. PowerPoint and Google Slides Compatibility:** This template is designed to be compatible with both PowerPoint and Google Slides. This dual compatibility ensures that you can create, edit, and present using your preferred platform without worrying about file conversions or compatibility issues.
**3. Wide Range of Slides:** The template includes a diverse array of slide types, including title slides, overview slides, detailed analysis slides, and concluding slides. Each type is crafted with the iceberg graphic, which serves as a thematic continuity throughout your presentation.
**4. Easy to Use:** Even if you are not a PowerPoint expert, you will find this template straightforward and user-friendly. The slides are structured in a way that allows you to plug in your data and go. Additionally, it comes with guiding notes to help you make the most out of each slide’s design features.
**5. Versatile Use:** Whether your data is financial, educational, scientific, or business-oriented, the iceberg graphic model lends itself beautifully to a variety of data types and storytelling approaches. It is particularly useful for presentations that require a reveal of layered information or a build-up from basic to complex ideas.
Make your next data presentation not just informative but also impressive with the Visualizing Data with Iceberg Graphics PowerPoint Presentation. It’s more than just a tool; it’s a game-changer for how you communicate data and insights visually.

Be the first to review “Visualizing Data With Iceberg Graphics PowerPoint Presentation”