

### Product Overview
Introducing the “Historical Data Review: Past Performance as a Guide” PowerPoint Presentation, a meticulously designed template crafted to aid professionals in analyzing and presenting historical data effectively. Whether you’re a business analyst, a market researcher, or a financial planner, this presentation template offers a robust foundation to showcase past trends, evaluate performance metrics, and draw insightful conclusions that inform future strategies.
This PowerPoint presentation is not just a tool but a comprehensive guide, equipped with a variety of slides tailored to represent historical data across different parameters and time frames. Each slide is carefully constructed to ensure clarity, impact, and engagement from your audience. The design incorporates clean lines, easy-to-read text formats, and logical flow, making complex data accessible and understandable.
### Detailed Description
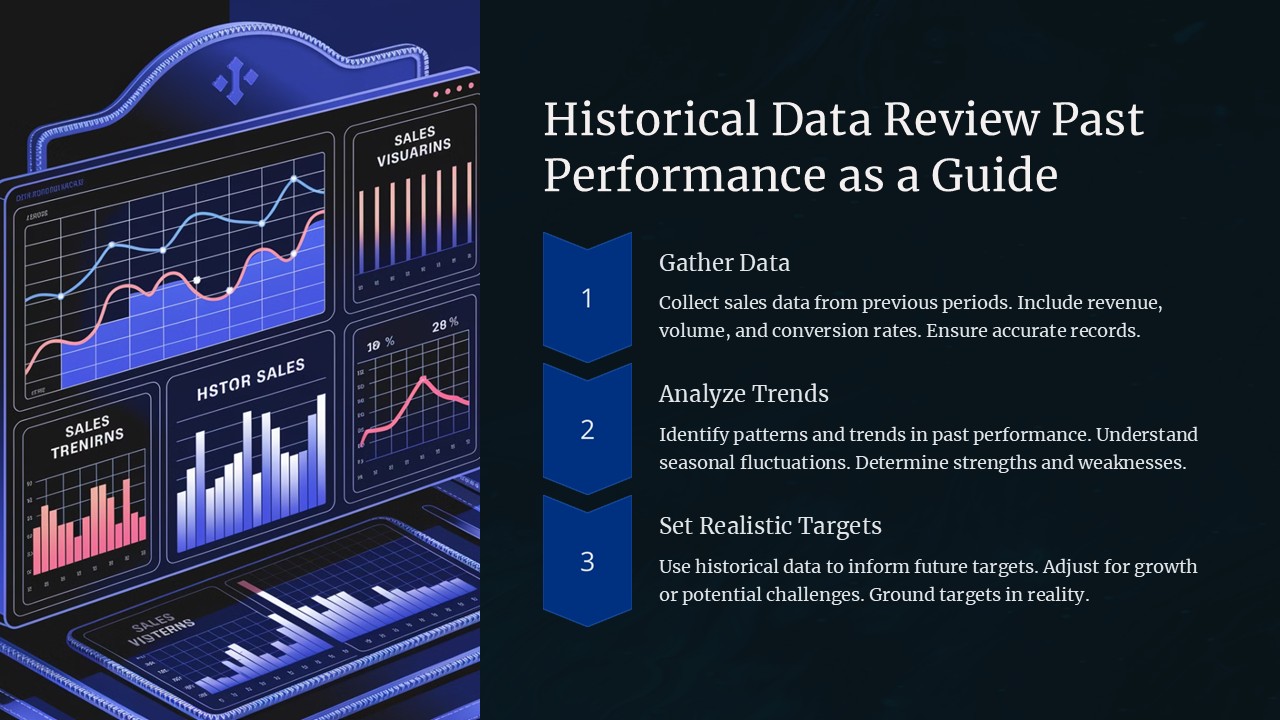
The “Historical Data Review: Past Performance as a Guide” presentation is your go-to solution for conveying intricate historical data in a straightforward and visually appealing manner. It begins with an introductory slide where you can set the context of your data review, followed by a series of slides designed to depict timelines, bar graphs, pie charts, and comparative analyses.
Key sections include a detailed timeline analysis, year-over-year performance reviews, sector-wise breakdowns, and predictive insights based on past data. The template also provides slides for SWOT analysis, helping you and your audience understand strengths, weaknesses, opportunities, and threats based on historical figures.
What sets this presentation apart is its narrative capability. It allows you to tell the story behind the numbers, making your data review not only informative but also engaging. The concluding section of the presentation offers summary slides where key takeaways can be highlighted, facilitating a clear and impactful closing argument or discussion.
### Features
– **Fully Editable Templates**: Each slide is fully editable, allowing you to customize fonts, colors, and backgrounds to align with your corporate branding or presentation context. This flexibility ensures that your presentation remains unique and tailored to your specific needs.
– **Supports PowerPoint and Google Slides**: Designed to be compatible with both PowerPoint and Google Slides, this template offers versatility regardless of your preferred presentation software. This compatibility ensures smooth transitions and animations, maintaining the professional look and feel of your presentation across platforms.
– **Variety of Charts and Diagrams**: Equipped with various types of charts and diagrams, including but not limited to bar graphs, pie charts, line graphs, and scatter plots. These tools are essential for a detailed and comprehensive data analysis presentation.
– **User-friendly Layout and Design**: The layout is structured to guide the viewer through the data in a logical flow, enhancing understanding and retention. The design is professional and clean, focusing the audience’s attention on the content rather than overwhelming them with excessive stylistic elements.
– **Comprehensive Analysis Tools**: Includes tools for SWOT analysis, comparative analysis, and predictive modeling slides, making it a comprehensive toolkit for any data-driven presentation.
### Conclusion
The “Historical Data Review: Past Performance as a Guide” PowerPoint Presentation is an essential tool for anyone looking to present historical data in a clear, effective, and persuasive manner. It is not just a presentation but a powerful analysis tool that brings data to life, making it an invaluable asset for businesses and professionals aiming to leverage past performance for future success. Whether for internal review, stakeholder presentations, or academic purposes, this template sets you up for clarity, impact, and professionalism.

Be the first to review “Historical Data Review Past Performance as a Guide PowerPoint Presentation”