


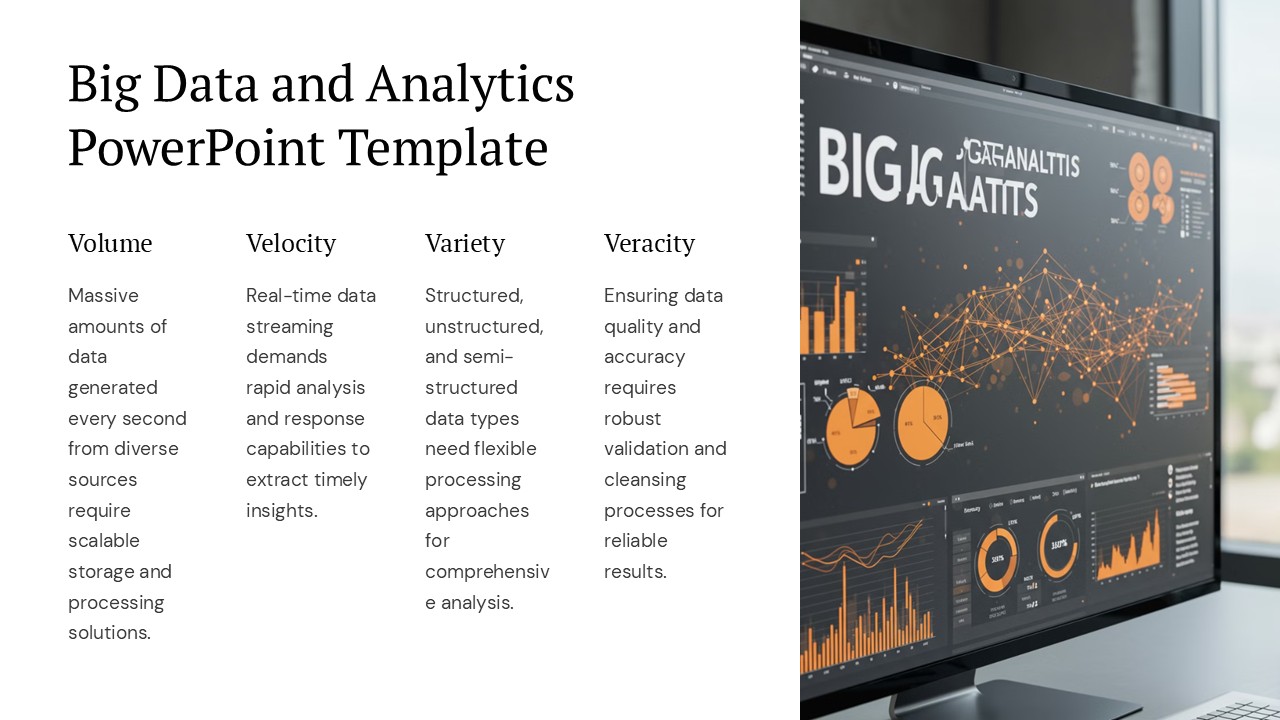
Introducing the Big Data and Analytics PowerPoint Template, a professionally designed presentation toolkit tailored specifically for data-driven businesses, analysts, and researchers who aim to showcase their findings and insights with precision and clarity. This comprehensive template set is perfect for presenting complex data analysis, trends, and big data strategies in a visually engaging manner that captures and holds audience attention.
The Big Data and Analytics PowerPoint Template is crafted to meet the needs of modern data analysis and presentation, featuring a sleek, professional design that aligns with current trends in data visualization. Each slide is thoughtfully designed to accommodate vast amounts of data without overwhelming your audience, making it easier to explain complicated concepts and data relationships.
**Visual Appeal and Functionality**
This template set includes a variety of slide designs, each tailored for different types of data presentation, such as pie charts, bar graphs, line charts, scatter plots, and more. The use of modern graphics and infographics helps in breaking down complex information into digestible visuals that are easy to understand. The color palette is carefully selected to enhance data visualization for better clarity and impact.
**Customization at Its Core**
One of the standout features of the Big Data and Analytics PowerPoint Template is its fully editable nature. Each element, from color schemes and fonts to graphics and layout, can be customized to suit your specific needs or to align with your company branding. This flexibility ensures that you can always deliver a unique and personalized presentation.
**Wide Compatibility**
The template supports both PowerPoint and Google Slides, ensuring you can work on your preferred platform without compatibility issues. This feature is particularly useful for teams that collaborate across different software environments, enabling seamless integration and editing.
**Key Features:**
– A comprehensive set of slides designed specifically for big data and analytics presentations.
– Fully editable templates allowing for complete customization of colors, text, icons, and graphics.
– Includes a variety of chart types and data visualization tools to present data in the most effective way.
– Compatible with Microsoft PowerPoint and Google Slides for versatility in editing and presenting.
– Modern and professional design that aligns with current visualization trends.
– Ideal for data analysts, business strategists, researchers, and educators.
**Ease of Use**
Whether you are a seasoned presenter or new to big data presentations, this PowerPoint template is straightforward to use. It comes with instructions for editing and customizing the slides, ensuring that even those with minimal graphic design experience can create stunning presentations.
**Conclusion**
The Big Data and Analytics PowerPoint Template is more than just a presentation tool; it is a comprehensive solution for communicating complex data insights in an accessible and engaging way. It is an essential tool for anyone involved in data analysis, business intelligence, or academic research. Elevate your presentations and convey your data stories with clarity and impact using this meticulously designed PowerPoint template.

Be the first to review “Big Data and Analytics PowerPoint Template PowerPoint Presentation”