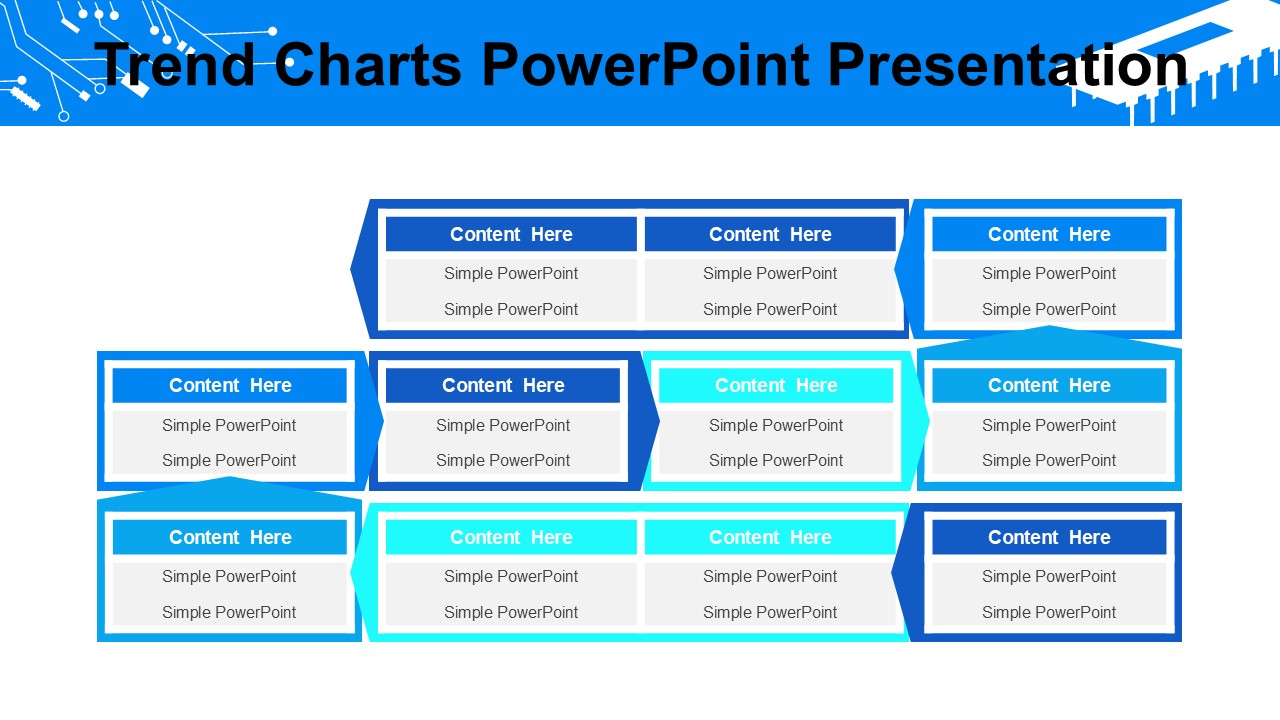
The Trend Charts PowerPoint Presentation is the perfect tool for professionals who need to showcase data trends in a visually appealing way. This comprehensive presentation template contains a variety of fully editable charts and graphs that can be easily customized to meet your specific needs.
With Trend Charts PowerPoint Presentation, you can effortlessly create professional-looking slides that effectively communicate complex data trends to your audience. Whether you are preparing a business report, research presentation, or sales pitch, this presentation template has got you covered.
Some key features of Trend Charts PowerPoint Presentation include:
1. Fully editable charts: Easily customize the color, size, and style of the charts to match your brand or presentation theme.
2. Data-driven charts: Simply input your data into the templates, and the charts will automatically update to reflect the changes.
3. Variety of chart types: Choose from a wide range of chart types, including line charts, bar graphs, pie charts, and more to effectively visualize your data.
4. Easy to use: This presentation template is user-friendly and does not require any specialized design skills. Simply drag and drop elements to create stunning slides in minutes.
5. Professional design: Impress your audience with clean and modern slide layouts that enhance the visual appeal of your data presentations.
Overall, the Trend Charts PowerPoint Presentation is a must-have tool for professionals who want to create impactful data visualizations. With its fully editable templates and user-friendly interface, you can easily craft compelling presentations that effectively communicate your data trends.


Be the first to review “Trend Charts PowerPoint Presentation”