Cycle diagrams are a versatile tool that can be used for a variety of purposes such as process illustration, project timelines, and data visualization. This type of graphic is ideal for showing a continuous cycle or sequence of events in a visually appealing way.
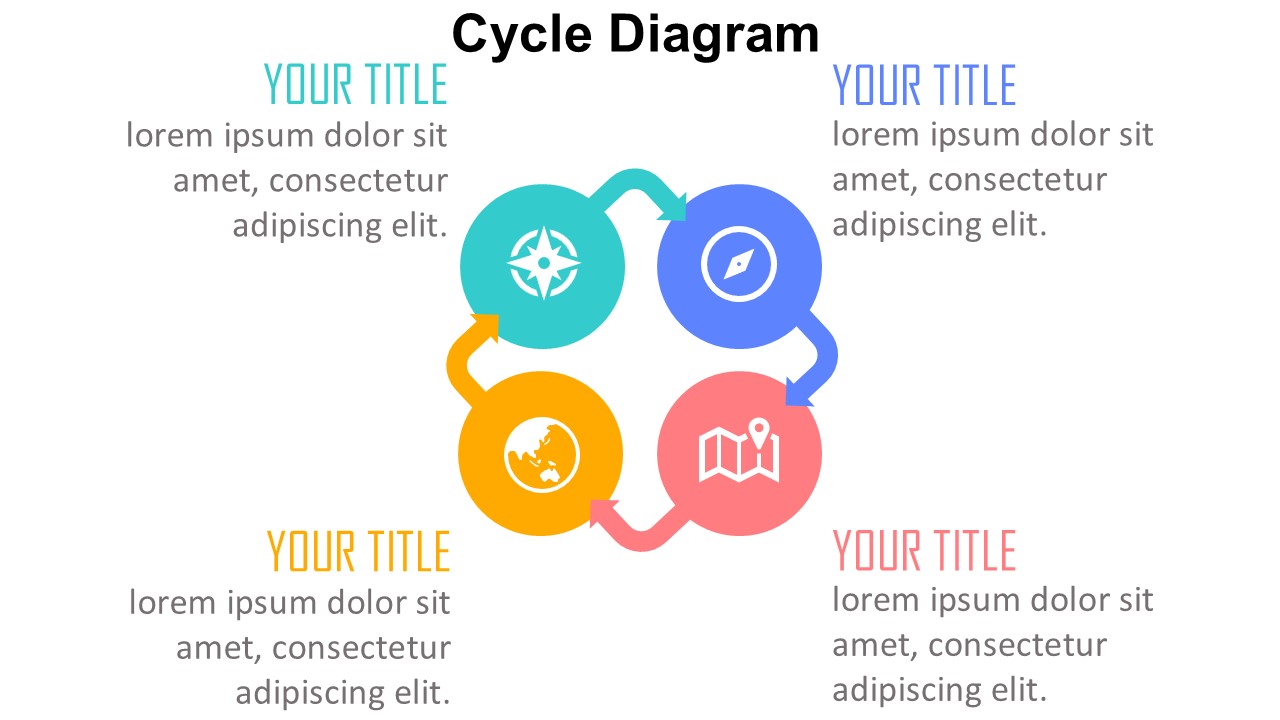
The cycle diagram typically consists of circular or oval shapes connected by arrows, forming a loop that represents the flow of information or progress. Each part of the cycle can be customized with different colors, icons, and text to highlight key points and make the diagram more engaging for the audience.
One of the main advantages of using a cycle diagram is its ability to simplify complex information and make it easier for viewers to understand. By breaking down a process or timeline into distinct stages, the cycle diagram helps to streamline communication and improve clarity.
In addition, cycle diagrams are also highly flexible and can be edited and modified to suit different needs and preferences. Whether you are creating a presentation, report, or infographic, the cycle diagram can be tailored to match your branding and design requirements.
Fully editable templates of cycle diagrams offer additional convenience and efficiency. These templates come with pre-designed layouts and elements that can be easily customized using editing software such as Adobe Illustrator or Microsoft PowerPoint. Users can change colors, add or remove shapes, and insert text to create a personalized cycle diagram that matches their content and style.
Overall, cycle diagrams are a valuable tool for visual communication and storytelling. With their versatility, simplicity, and customization options, they can help to enhance the impact of your message and engage your audience effectively.


Be the first to review “Cycle Diagram”