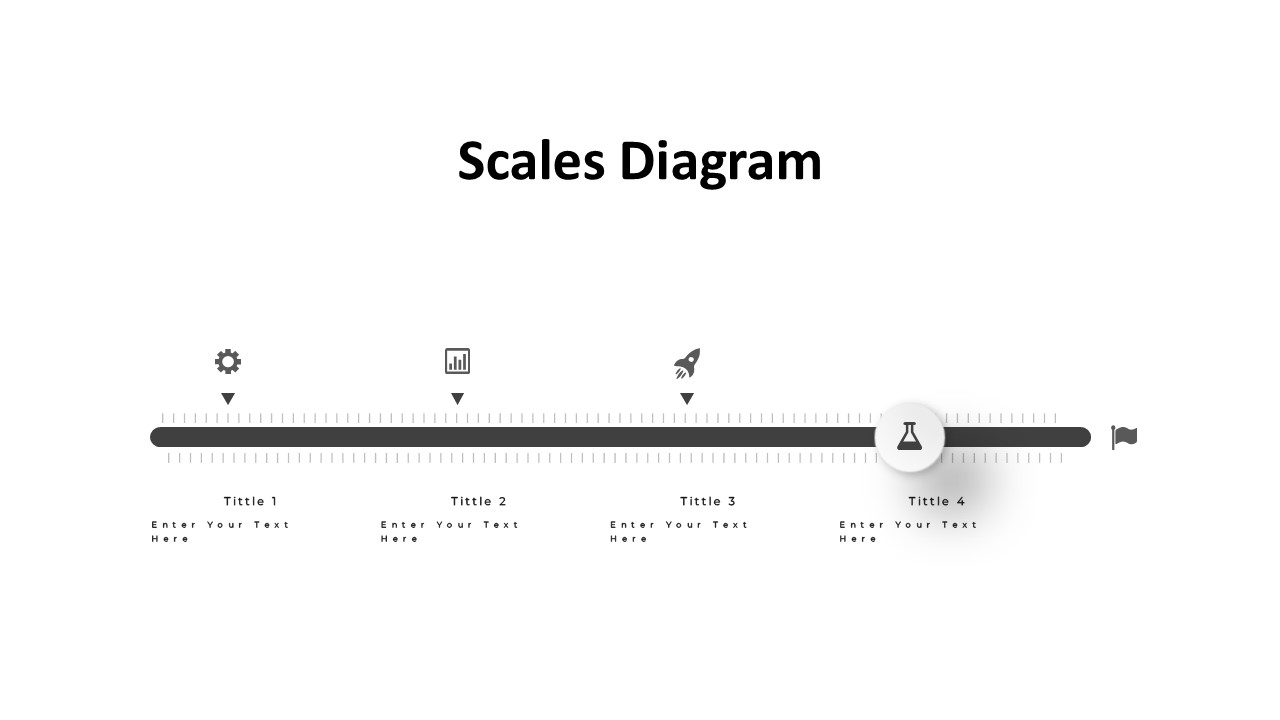
The Scales Diagram is a versatile tool that allows users to visually represent data in a clear and organized manner. This diagram is commonly used in business presentations, educational materials, and project reports to showcase comparisons, relationships, and proportions between different elements.
The Scales Diagram features a set of interconnected scales that can be customized to fit specific data points. Users can easily add or remove scales, adjust their sizes, and modify their positions to create a tailored diagram that effectively communicates their message. The diagram can be color-coded to highlight important information, and text labels can be added to provide further context.
One of the key benefits of the Scales Diagram is its flexibility and ease of use. Users can quickly update the diagram with new data or make changes to existing information without having to start from scratch. This makes it a valuable tool for professionals who need to create visual representations of complex data sets on a regular basis.
In addition to its user-friendly design, the Scales Diagram also offers fully editable templates that provide a starting point for creating customized diagrams. These templates include pre-set scales, layouts, and formatting options that can be easily adjusted to suit individual needs. With these templates, users can save time and effort while still producing high-quality visualizations.
Overall, the Scales Diagram is a valuable asset for anyone looking to effectively communicate data in a clear and engaging way. Its customizable features, ease of use, and fully editable templates make it an essential tool for professionals in a wide range of fields.


Be the first to review “Scales Diagram”