Skip to content
    • Log In
    • Register
  • BLOG
  • FAQ
  • ABOUT US
  • CONTACT US
  • PRIVACY POLICY
  • Plans & Pricing
    • Log In
    • Register
SlidevillaSlidevilla

  • Plans & Pricing
  • ALL PRODUCTS
  • Login
  • PowerPoint Templates
    • Agile
    • Business PowerPoint Templates
    • Roadmap
    • Strategy
    • PowerPoint Backgrounds
    • Resume Templates
    • Progressive Roadmap
    • Self Introcution PPT
    • Diversity And Inclusion PPT
    • Roadmap PPT
    • Social Media
    • Kids
    • Idea
    • Health And Fitness
    • Technology
    • Pricing
    • PowerPoint Presentations
    • Slide Deck
  • PowerPoint Diagrams
    • Arrow Diagrams
    • Circular Diagrams
    • Flow Chart Diagrams
    • Funnel Diagrams
    • Process Flow Diagrams
    • Segmented Diagrams
    • Staged Diagrams
  • Power Point Maps
    • Africa
    • Asia
    • South America
    • Central America
    • Europe
    • North America
    • Oceania
    • World Maps & Globes
  • PowerPoint Shapes
    • 3D Shapes for PowerPoint
    • Cartoons
    • Creative
    • Gauges & Meters
    • Recycle
    • Traffic Lights & Signs Gears
  • Data & Charts
    • Bar Chart Presentation
    • Curves and Statistical
    • Pie Charts
    • Dashboards
  • Text & Tables
    • Creative Layouts
    • Comparison PPT Template
    • Comparison Template
  • Login
Home / Shop / PowerPoint Templates
Add to Wishlist

Data Visualization Infographic PowerPoint Presentation PPT

Download

Category: PowerPoint Templates
Browse
  • Data & Charts
    • Bar Chart Presentation
    • Curves and Statistical
    • Dashboards
    • Pie Charts
  • Free for All
  • Power Point Maps
    • Africa
    • Asia
    • Central America
    • Europe
    • North America
    • Oceania
    • South America
    • World Maps & Globes
  • Power Point Text & Tables
    • Comparison PPT Template
    • Creative Layouts
  • PowerPoint Diagrams
    • Arrow Diagrams
    • Circular Diagrams
    • Flow Chart Diagrams
    • Funnel Diagrams
    • Process Flow Diagrams
    • Segmented Diagrams
    • Staged Diagrams
  • PowerPoint Presentations
  • PowerPoint Shapes
    • 3D Shapes for PowerPoint
    • Cartoons
    • Creative
    • Gauges & Meters
    • Recycle
    • Traffic Lights & Signs Gears
  • PowerPoint Templates
    • Agile
    • Business PowerPoint Templates
    • Health And Fitness
    • Idea
    • Kids
    • PowerPoint Backgrounds
    • Pricing
    • Resume Templates
    • Roadmap
    • Social Media
    • Strategy
    • Technology
  • Slide Deck
  • Description
  • Reviews (0)

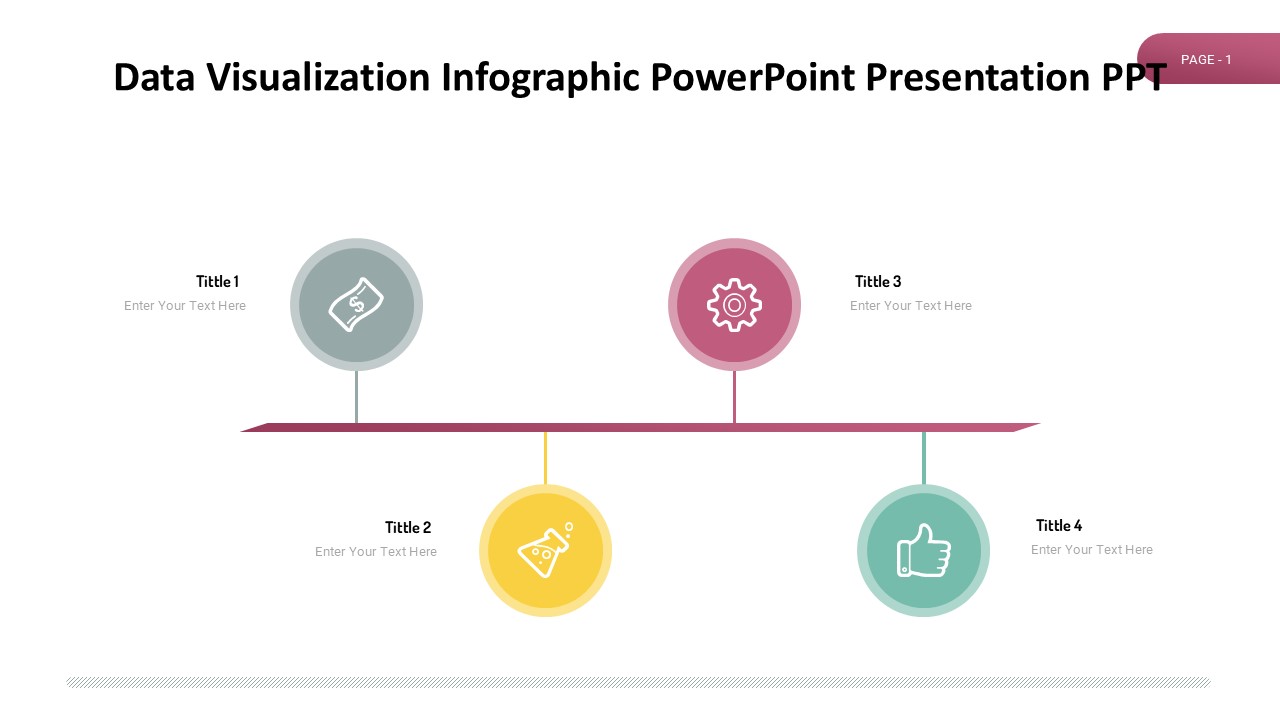
Are you looking to present complex data in a visually appealing way? Our Data Visualization Infographic PowerPoint Presentation PPT is the perfect solution for you. This professionally designed template is ideal for creating impactful presentations that effectively communicate your data insights.

This Data Visualization Infographic PowerPoint Presentation PPT includes a variety of infographic elements such as charts, graphs, diagrams, and icons that can help you illustrate your data in a clear and engaging manner. Whether you are presenting sales trends, marketing analysis, financial reports, or any other type of data, this template has everything you need to make your presentation stand out.

With easy-to-edit slides, you can customize the colors, fonts, and content to suit your branding and messaging. This template is designed to save you time and effort, allowing you to focus on crafting a compelling narrative around your data.

Features:
1. Fully Editable Templates: Easily customize the colors, fonts, and content to match your brand or presentation theme.
2. Infographic Elements: Includes a wide variety of charts, graphs, diagrams, and icons to help you visualize your data effectively.
3. Professional Design: Professionally designed slides to give your presentation a polished and modern look.
4. Easy-to-Use: User-friendly interface that allows you to quickly create stunning data visualizations without any design experience.
5. Versatile: Suitable for all types of data presentations, from sales reports to academic research findings.

In conclusion, our Data Visualization Infographic PowerPoint Presentation PPT is a versatile and user-friendly template that will help you create engaging and impactful data presentations. Whether you are a business professional, educator, or researcher, this template will make your data stand out and leave a lasting impression on your audience.

Reviews

There are no reviews yet.

Be the first to review “Data Visualization Infographic PowerPoint Presentation PPT” Cancel reply

Best Selling
  • Editable Brazil Map Template for PowerPoint
  • Conference agenda powerpoint template slide Conference agenda powerpoint template slide
  • Chemical Industry shapes Chemical Industry shapes
  • Organization Chart PowerPoint Template Organization Chart PowerPoint Template
    Rated 4.69 out of 5
Slides
  • Visualizing Data With Iceberg Graphics PowerPoint Presentation
  • World Map Travel PowerPoint Presentation
  • World Map Arrows PowerPoint Presentation
  • Timeline With Phases PowerPoint Presentation
Featured
  • Go to Market Strategy template Go to Market Strategy template
    Rated 4.40 out of 5
    £5.00
  • Conference agenda powerpoint template slide Conference agenda powerpoint template slide
  • Chemical Industry shapes Chemical Industry shapes
  • Organization Chart PowerPoint Template Organization Chart PowerPoint Template
    Rated 4.69 out of 5
Top Rated
  • Gadgets Comparison Table for PowerPoint Template
    Rated 5.00 out of 5
  • Resignation letter template slide for powerpoint Resignation letter template slide for powerpoint
    Rated 5.00 out of 5
  • Current State Vs Future State Infographics PowerPoint Template Current State Vs Future State Infographics PowerPoint Template
    Rated 5.00 out of 5
  • Recruitment and Selection Policy PowerPoint Presentation Recruitment and Selection Policy PowerPoint Presentation
    Rated 5.00 out of 5
Our Clinets
COMPANY
  • BLOG
  • FAQ
  • ABOUT US
  • CONTACT US
  • PRIVACY POLICY
Product categories
  • Data & Charts
    • Bar Chart Presentation
    • Curves and Statistical
    • Dashboards
    • Pie Charts
  • Free for All
  • Power Point Maps
    • Africa
    • Asia
    • Central America
    • Europe
    • North America
    • Oceania
    • South America
    • World Maps & Globes
  • Power Point Text & Tables
    • Comparison PPT Template
    • Creative Layouts
  • PowerPoint Diagrams
    • Arrow Diagrams
    • Circular Diagrams
    • Flow Chart Diagrams
    • Funnel Diagrams
    • Process Flow Diagrams
    • Segmented Diagrams
    • Staged Diagrams
  • PowerPoint Presentations
  • PowerPoint Shapes
    • 3D Shapes for PowerPoint
    • Cartoons
    • Creative
    • Gauges & Meters
    • Recycle
    • Traffic Lights & Signs Gears
  • PowerPoint Templates
    • Agile
    • Business PowerPoint Templates
    • Health And Fitness
    • Idea
    • Kids
    • PowerPoint Backgrounds
    • Pricing
    • Resume Templates
    • Roadmap
    • Social Media
    • Strategy
    • Technology
  • Slide Deck
Recent Posts
  • Best Acknowledgment Samples and examples
  • 23
    Jul
    Você sabe que a roda de cores simples pode chamar a atenção?
  • Do you know the simple color wheel can catch the eye?
Copyright 2025 © SlideVilla.Com
  • Login
  • Sign Up
Forgot Password?
Lost your password? Please enter your username or email address. You will receive a link to create a new password via email.
Connect with:
Google

Login

Lost your password?

Register

Your personal data will be used to support your experience throughout this website, to manage access to your account, and for other purposes described in our privacy policy.