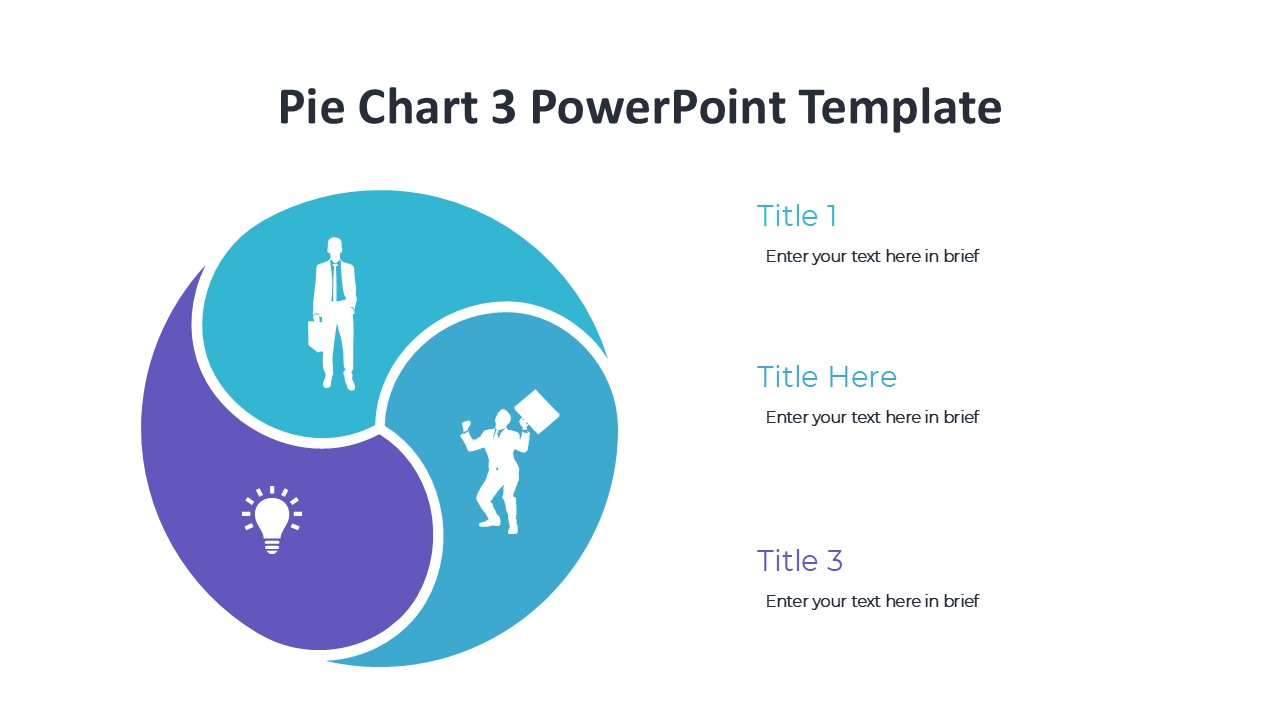
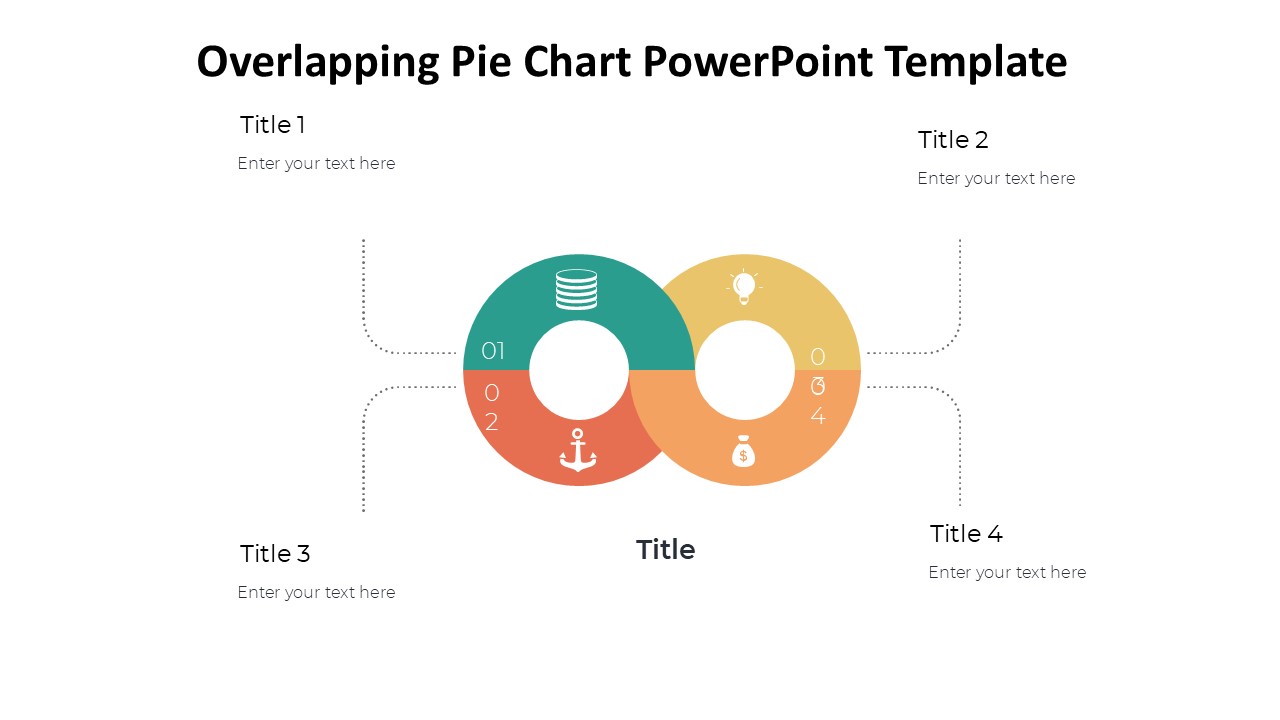
Enhance your data visualization with the Overlapping Pie Chart PowerPoint Template. This professionally designed template features a modern and sleek design that will captivate your audience during presentations. The overlapping pie charts allow you to effectively illustrate the relationships between different data sets, making complex information easy to understand at a glance.
With this template, you can easily customize the colors, sizes, and labels of the pie charts to suit your specific data and branding requirements. The user-friendly interface ensures that you can quickly edit the charts without the need for advanced design skills. Whether you are presenting sales figures, market trends, or project timelines, this template will help you convey your message in a visually engaging way.
Key features of the Overlapping Pie Chart PowerPoint Template:
1. Fully editable charts: Easily customize the colors, sizes, and labels to match your data and branding guidelines.
2. Modern design: The sleek and sophisticated design will impress your audience and enhance the visual appeal of your presentations.
3. User-friendly interface: Edit the charts with ease, even if you are not a design expert.
4. Versatile usage: Perfect for showcasing relationships between different data sets, such as market share, budget allocation, and more.
5. Time-saving: Save time on designing charts from scratch and focus on creating impactful presentations.
With the Overlapping Pie Chart PowerPoint Template, you can elevate your data presentations and make a lasting impression on your audience. Download this template today and take your data visualization to the next level.


Be the first to review “Overlapping Pie Chart PowerPoint Template”