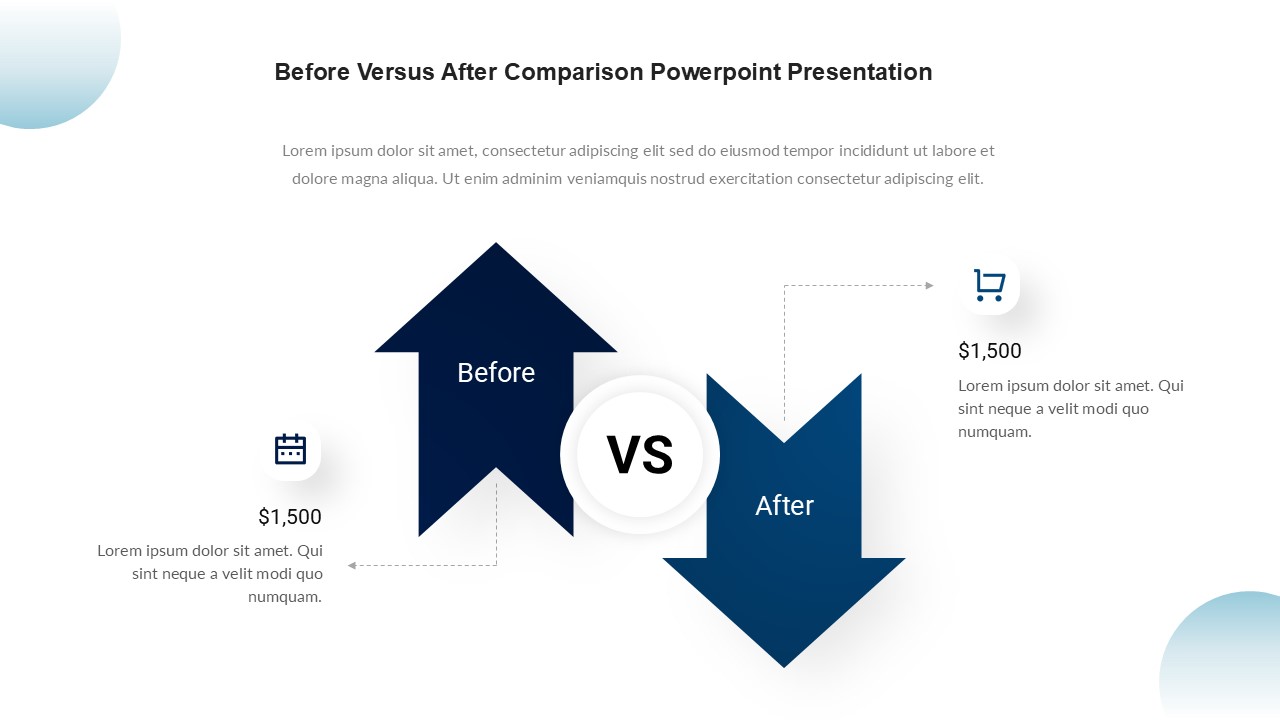
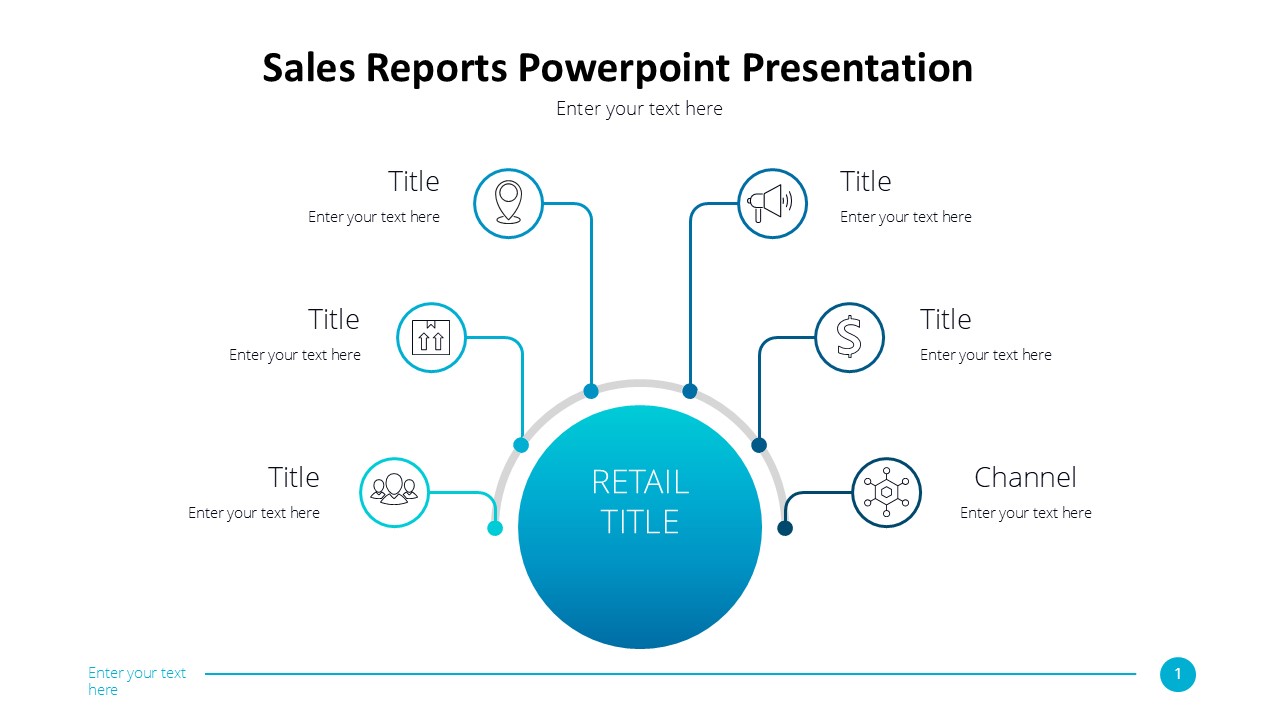
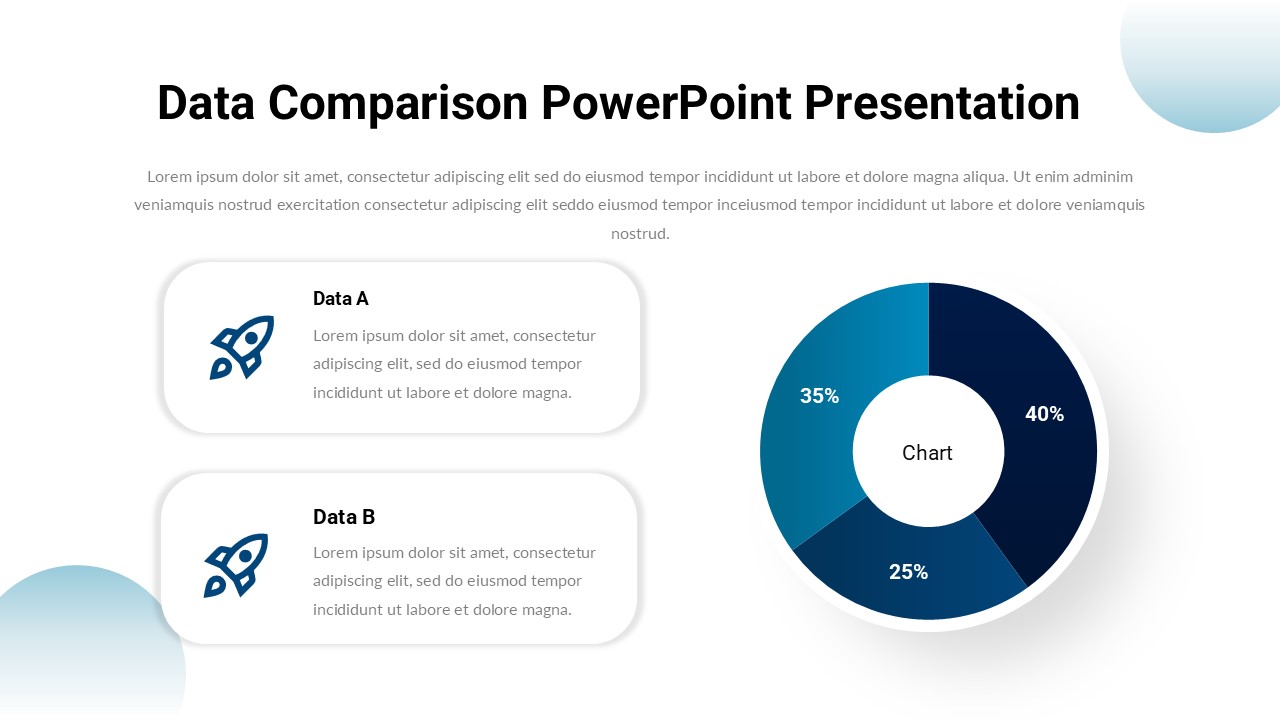
Introducing the Data Comparison PowerPoint Presentation, a powerful tool designed to help you create visually compelling comparisons of data in a clear and concise manner. This presentation template is perfect for professionals, businesses, or educators who need to showcase numerical information in an engaging way.
With a modern and sleek design, the Data Comparison PowerPoint Presentation includes a variety of slides featuring different layouts and styles to suit your specific needs. Whether you’re comparing sales figures, market trends, performance metrics, or any other type of data, this template provides you with all the tools you need to present your information effectively.
One of the key features of the Data Comparison PowerPoint Presentation is its fully editable templates. This means that you can easily customize the slides to match your branding, add your own data points, and adjust the layouts to best display your information. Whether you prefer bar graphs, pie charts, tables, or any other type of visualization, you can easily rearrange the elements to create a presentation that meets your exact requirements.
In addition to being fully editable, the templates in this presentation also feature professional design elements such as modern fonts, eye-catching colors, and clean layouts. This ensures that your data will be presented in a polished and professional manner, helping you make a lasting impression on your audience.
Overall, the Data Comparison PowerPoint Presentation is a versatile and user-friendly tool that will help you create impactful data comparisons with ease. Whether you’re a seasoned presenter or new to the world of data visualization, this template will simplify the process and allow you to focus on delivering your message effectively. Upgrade your presentations with the Data Comparison PowerPoint Presentation and take your data comparisons to the next level.


Be the first to review “Data Comparison PowerPoint Presentation”