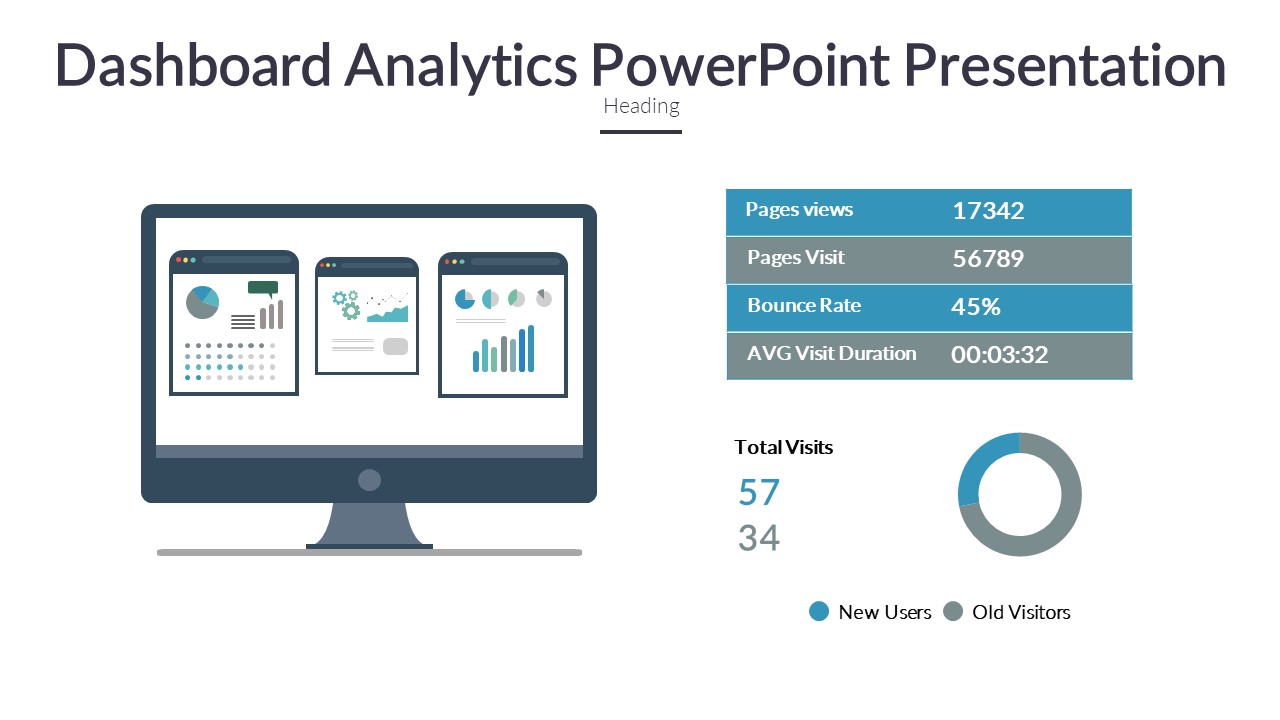
Dashboard Analytics PowerPoint Presentation is a comprehensive set of professionally designed slides that will help you visualize and analyze data in a clear and impactful way. This presentation template is perfect for business meetings, strategy sessions, or any other occasion where data-driven insights are needed.
This PowerPoint presentation includes a variety of dashboard layouts, charts, graphs, and tables that can be easily customized to suit your specific needs. Whether you are presenting sales data, financial metrics, market trends, or any other type of information, this template will help you create compelling and informative visuals that will impress your audience.
With a clean and modern design, the Dashboard Analytics PowerPoint Presentation is easy to navigate and use. The slides are fully editable, allowing you to change colors, fonts, and layout to match your branding or personal style. You can also add your own data directly into the charts and tables, making it easy to update and customize your presentation as needed.
Key Features:
1. Fully editable templates: Customize colors, fonts, and layout to match your branding.
2. Variety of dashboard layouts: Choose from a range of different designs to suit your data visualization needs.
3. Charts and graphs: Easily add and edit data in the charts and graphs to create informative visuals.
4. Modern design: Impress your audience with a clean and professional presentation layout.
5. Easy to use: Navigate through the slides and customize them with ease.
Overall, the Dashboard Analytics PowerPoint Presentation is a versatile and user-friendly template that will help you create engaging and informative presentations with ease. Whether you are a business professional, analyst, or student, this template is a valuable tool for showcasing data in a visually appealing way.


Be the first to review “Dashboard Analytics PowerPoint Presentation”